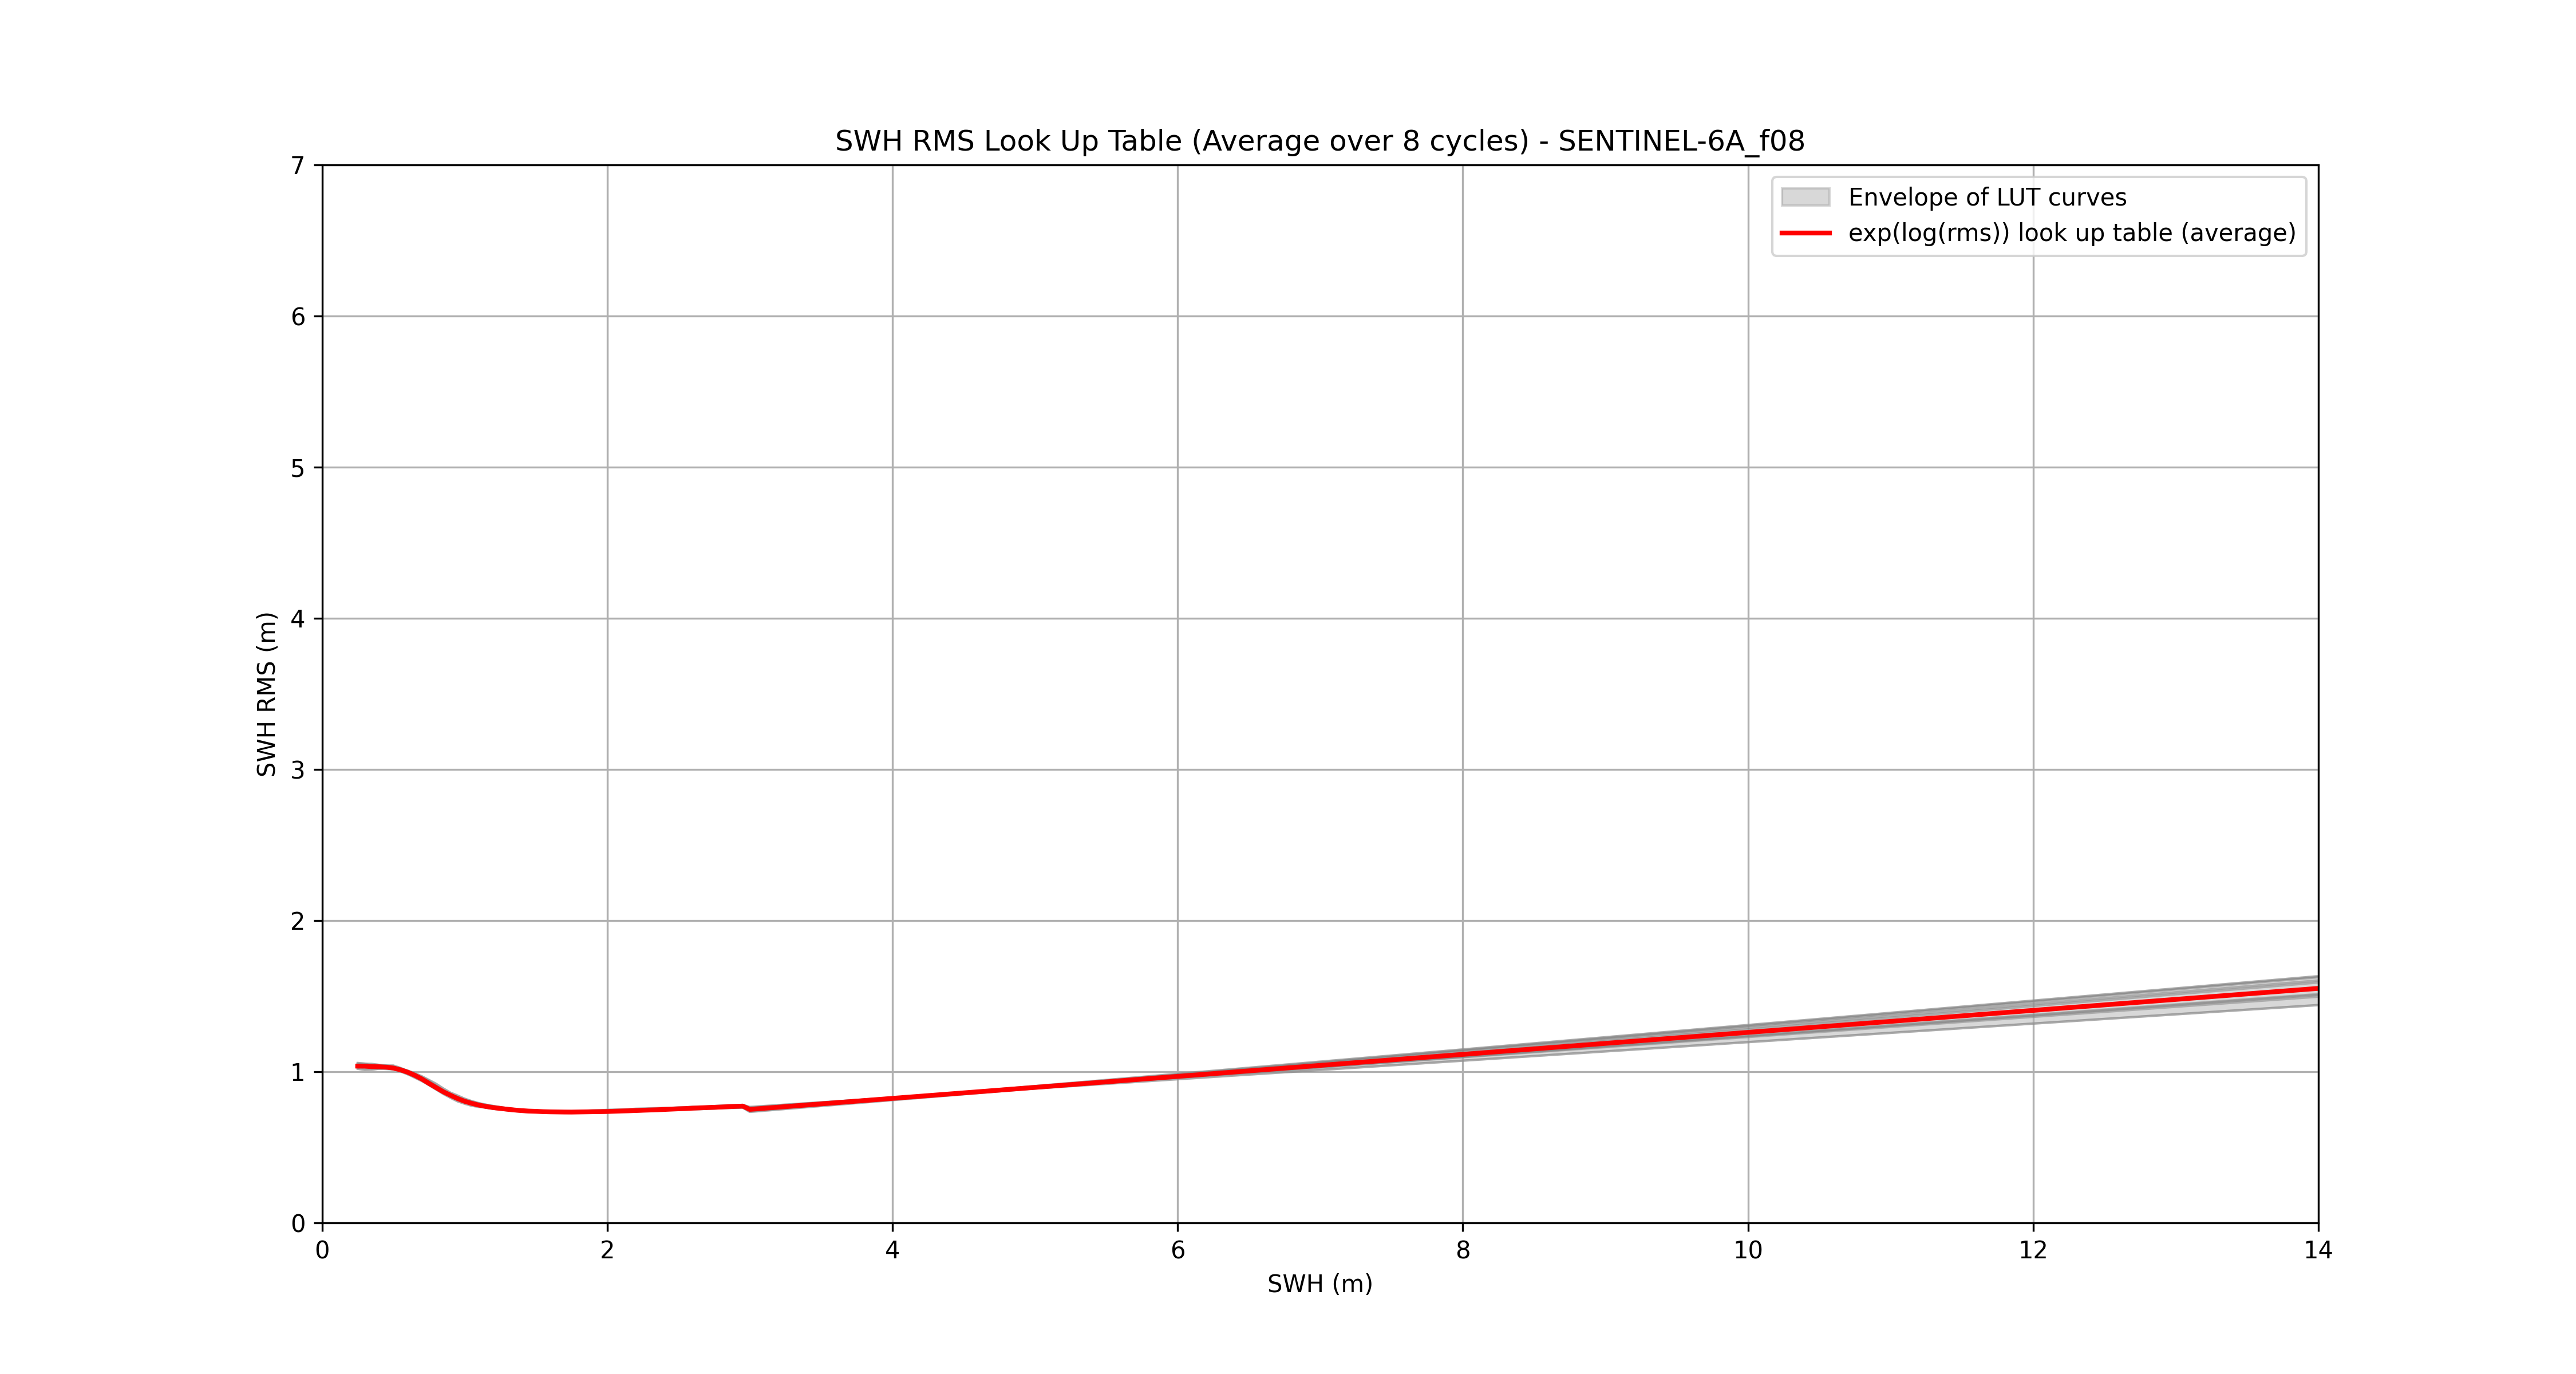
Look-Up Tables for SWH RMS test#
This section describes in further details the methodology used to build the SWH RMS Look-Up Tables (LUT) used to filter out bad 1 Hz measurements.
Selected cycles#
The calculation of a SWH RMS LUT is applied to each altimeter mission on 8 cycles. The number of cycles is a trade-off between CPU time and statistical robustness of the proposed diagnostics.
The selected cycles correspond to periods of nominal orbit and nominal functioning of the altimeter:
Mission |
Cycles |
|---|---|
ERS-1 |
154-92-84-146-148-149-151-98 |
ERS-2 |
50-82-43-63-45-76-46-36 |
TOPEX-A1 |
108-112-122-16-22-25-67-73 |
TOPEX-A2 |
134-143-148-158-198-208-218-221 |
TOPEX-B |
246-254-306-328-364-428-444-453 |
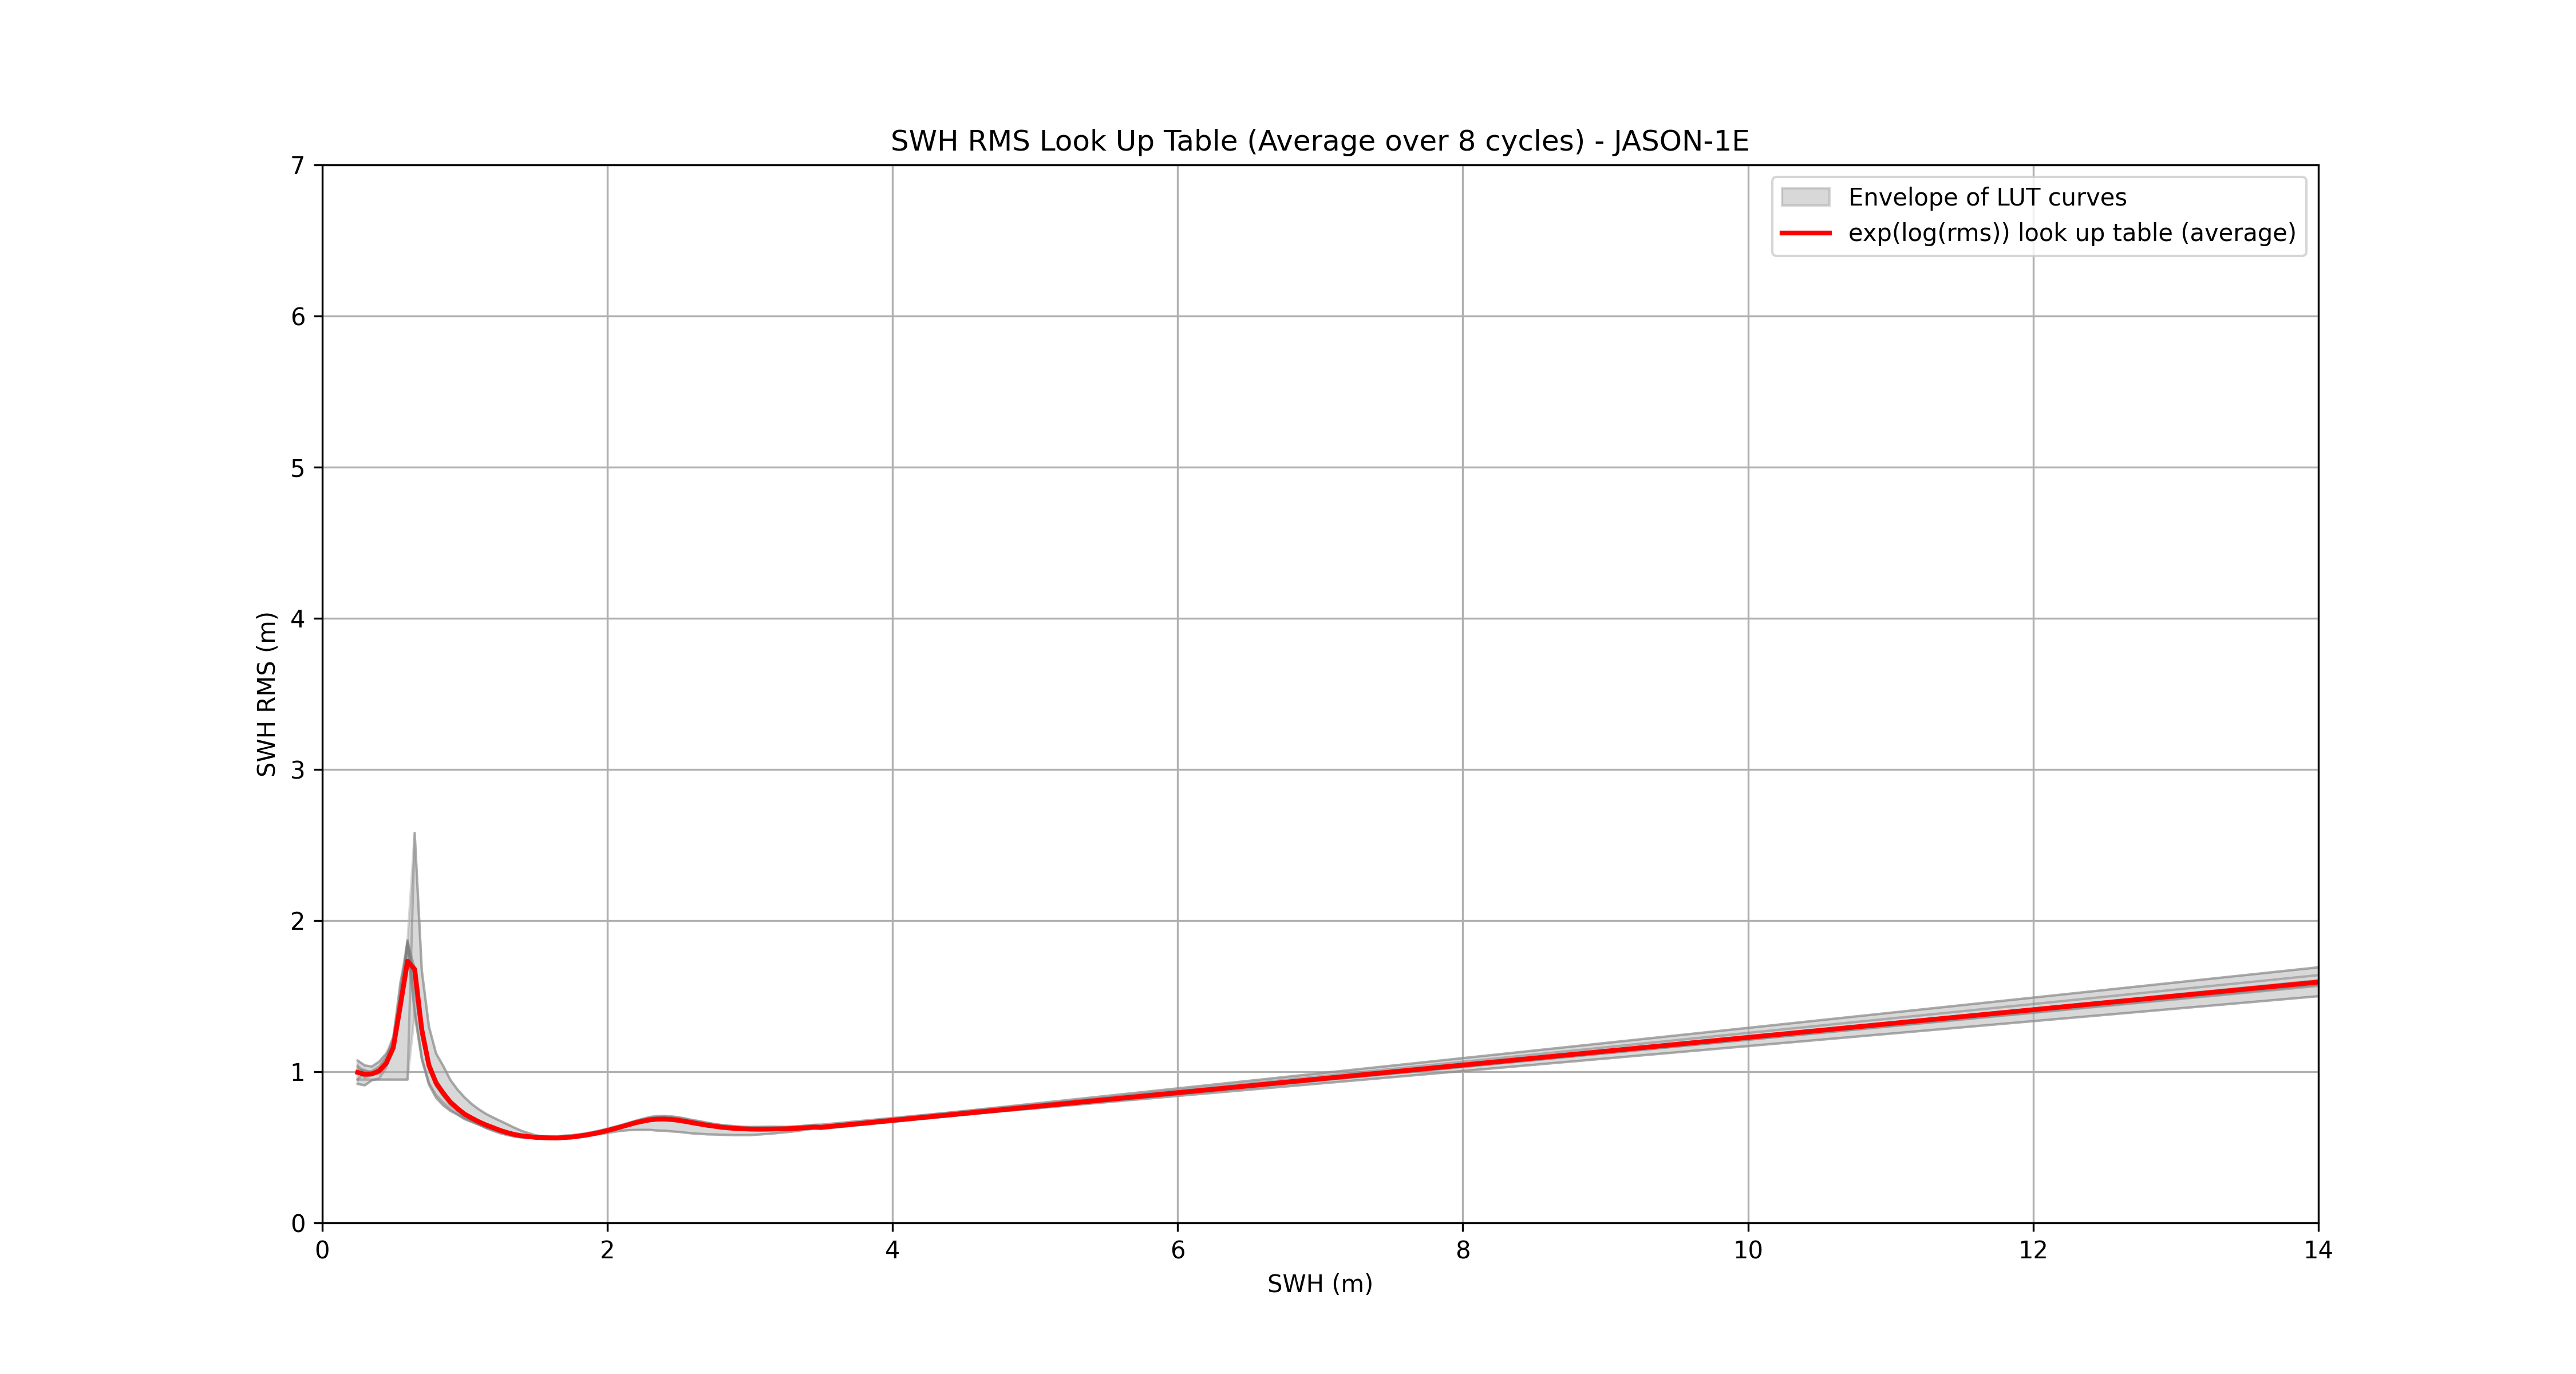
JASON-1E |
184-79-191-339-96-510-512-253 |
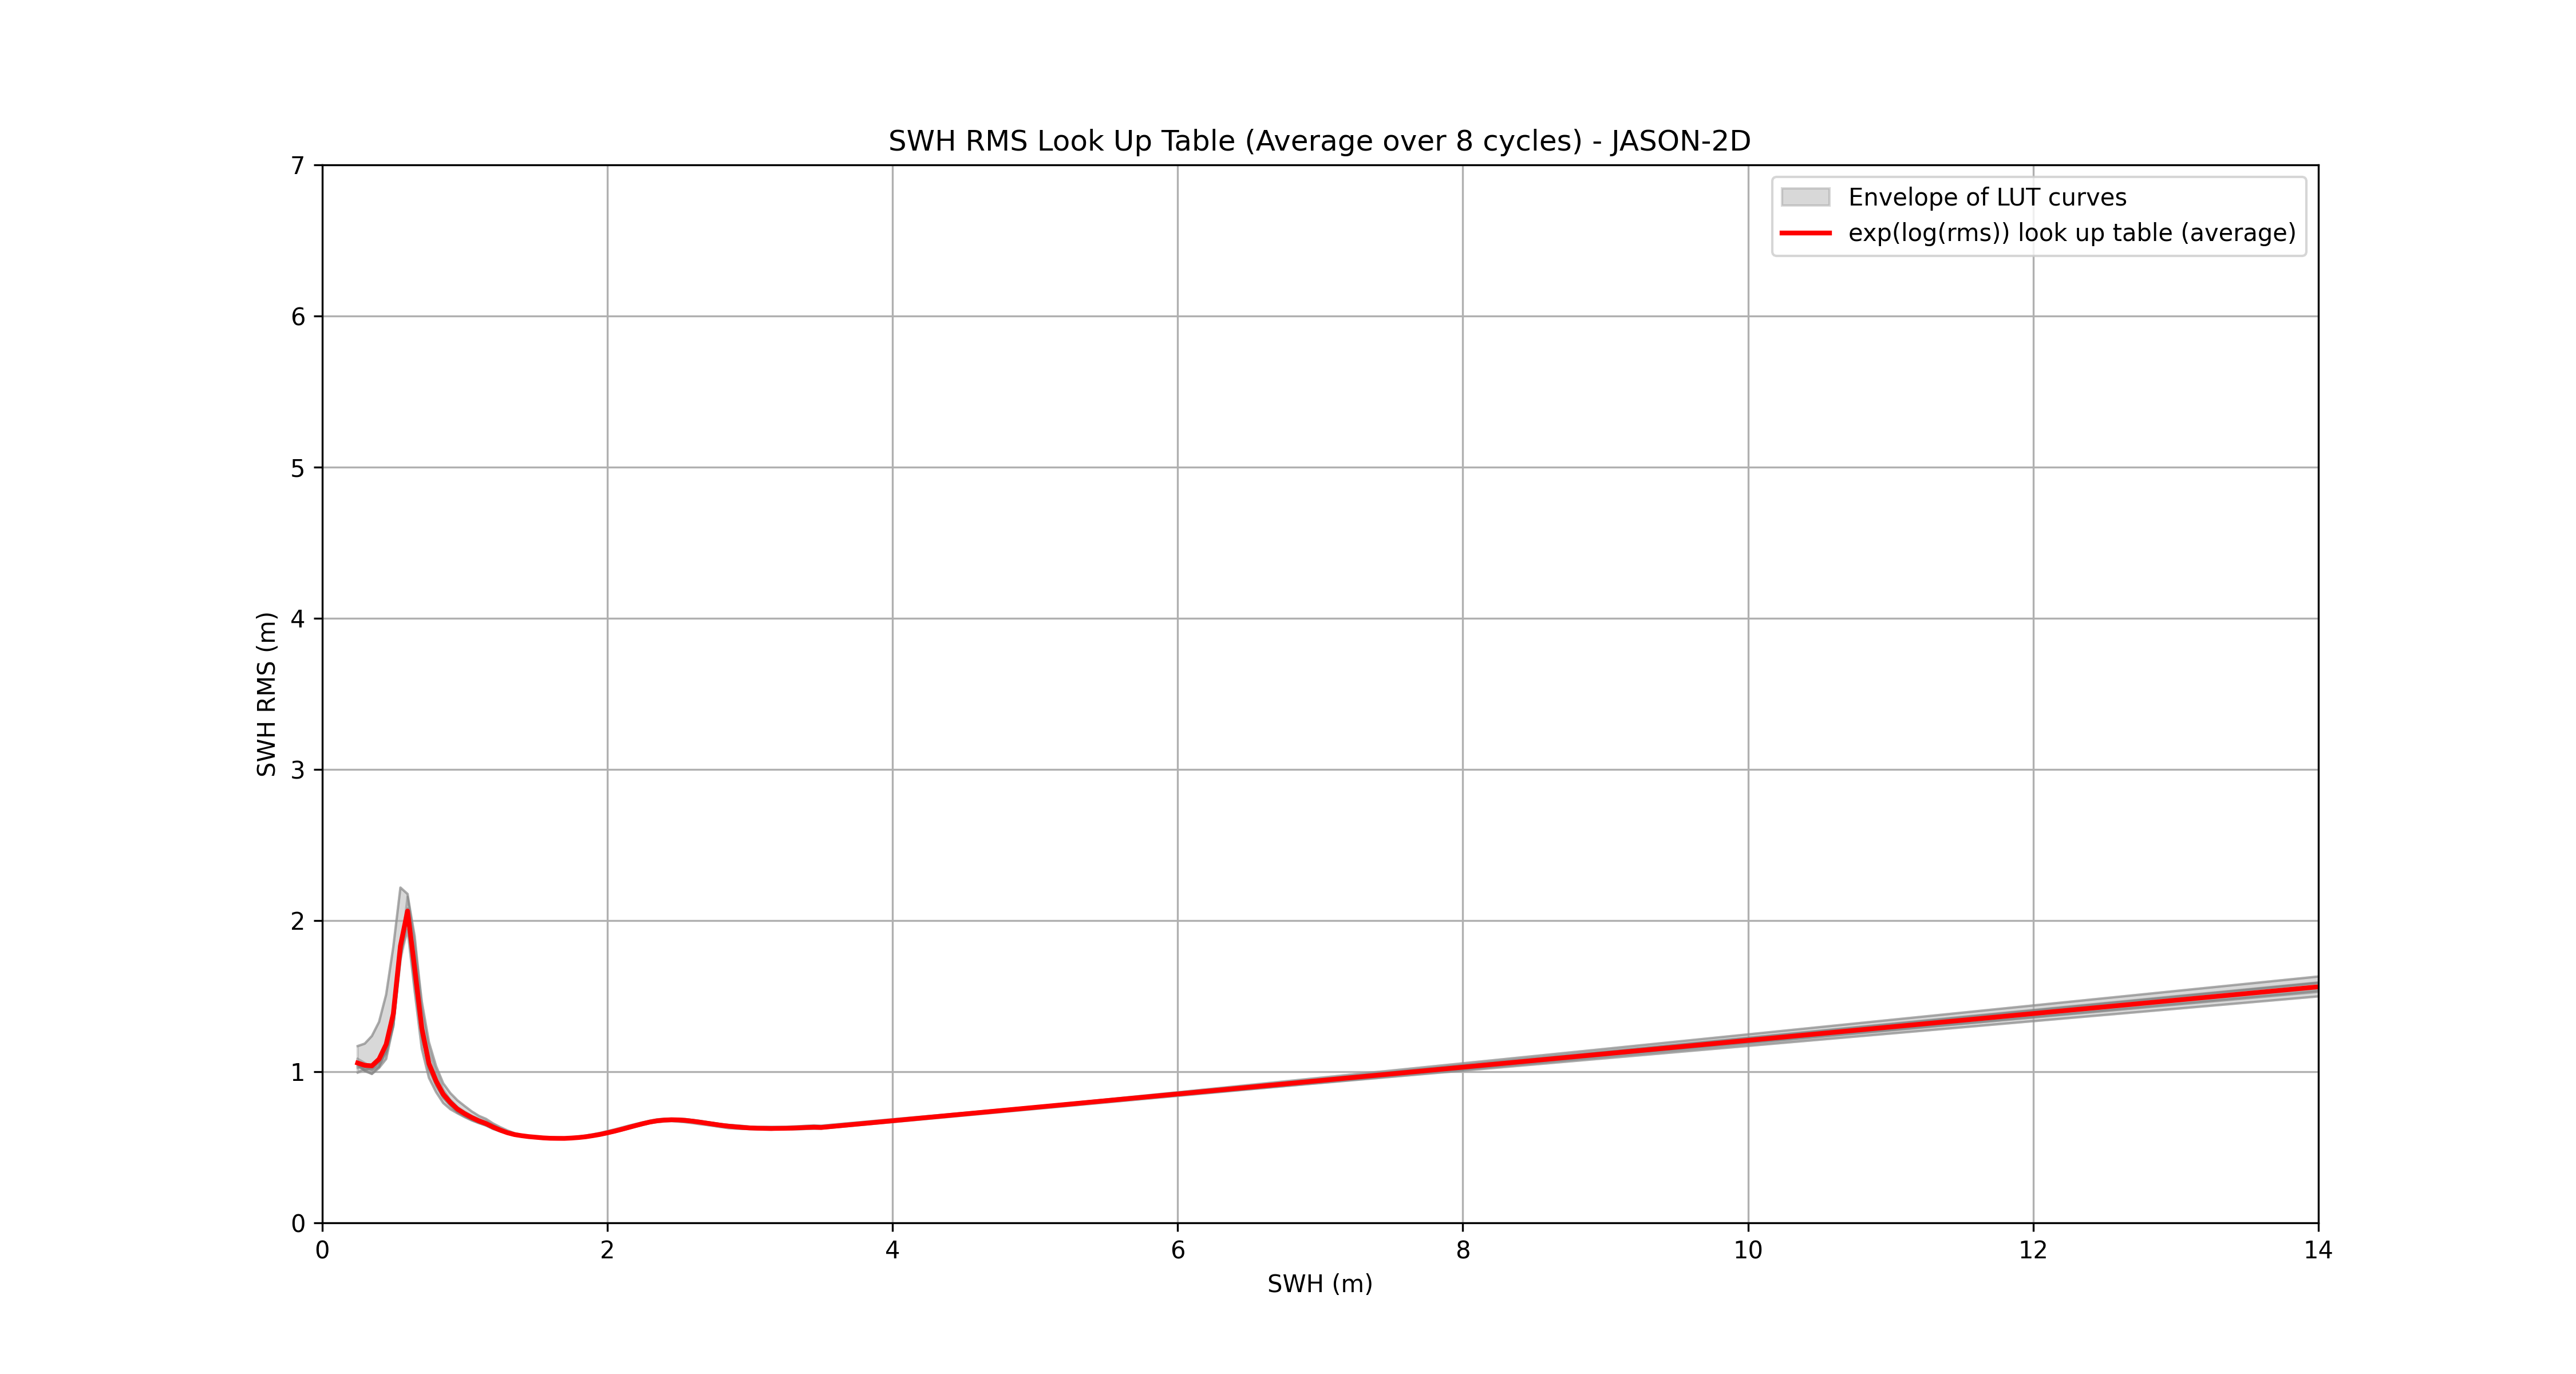
JASON-2D |
206-319-179-286-146-3-48-195 |
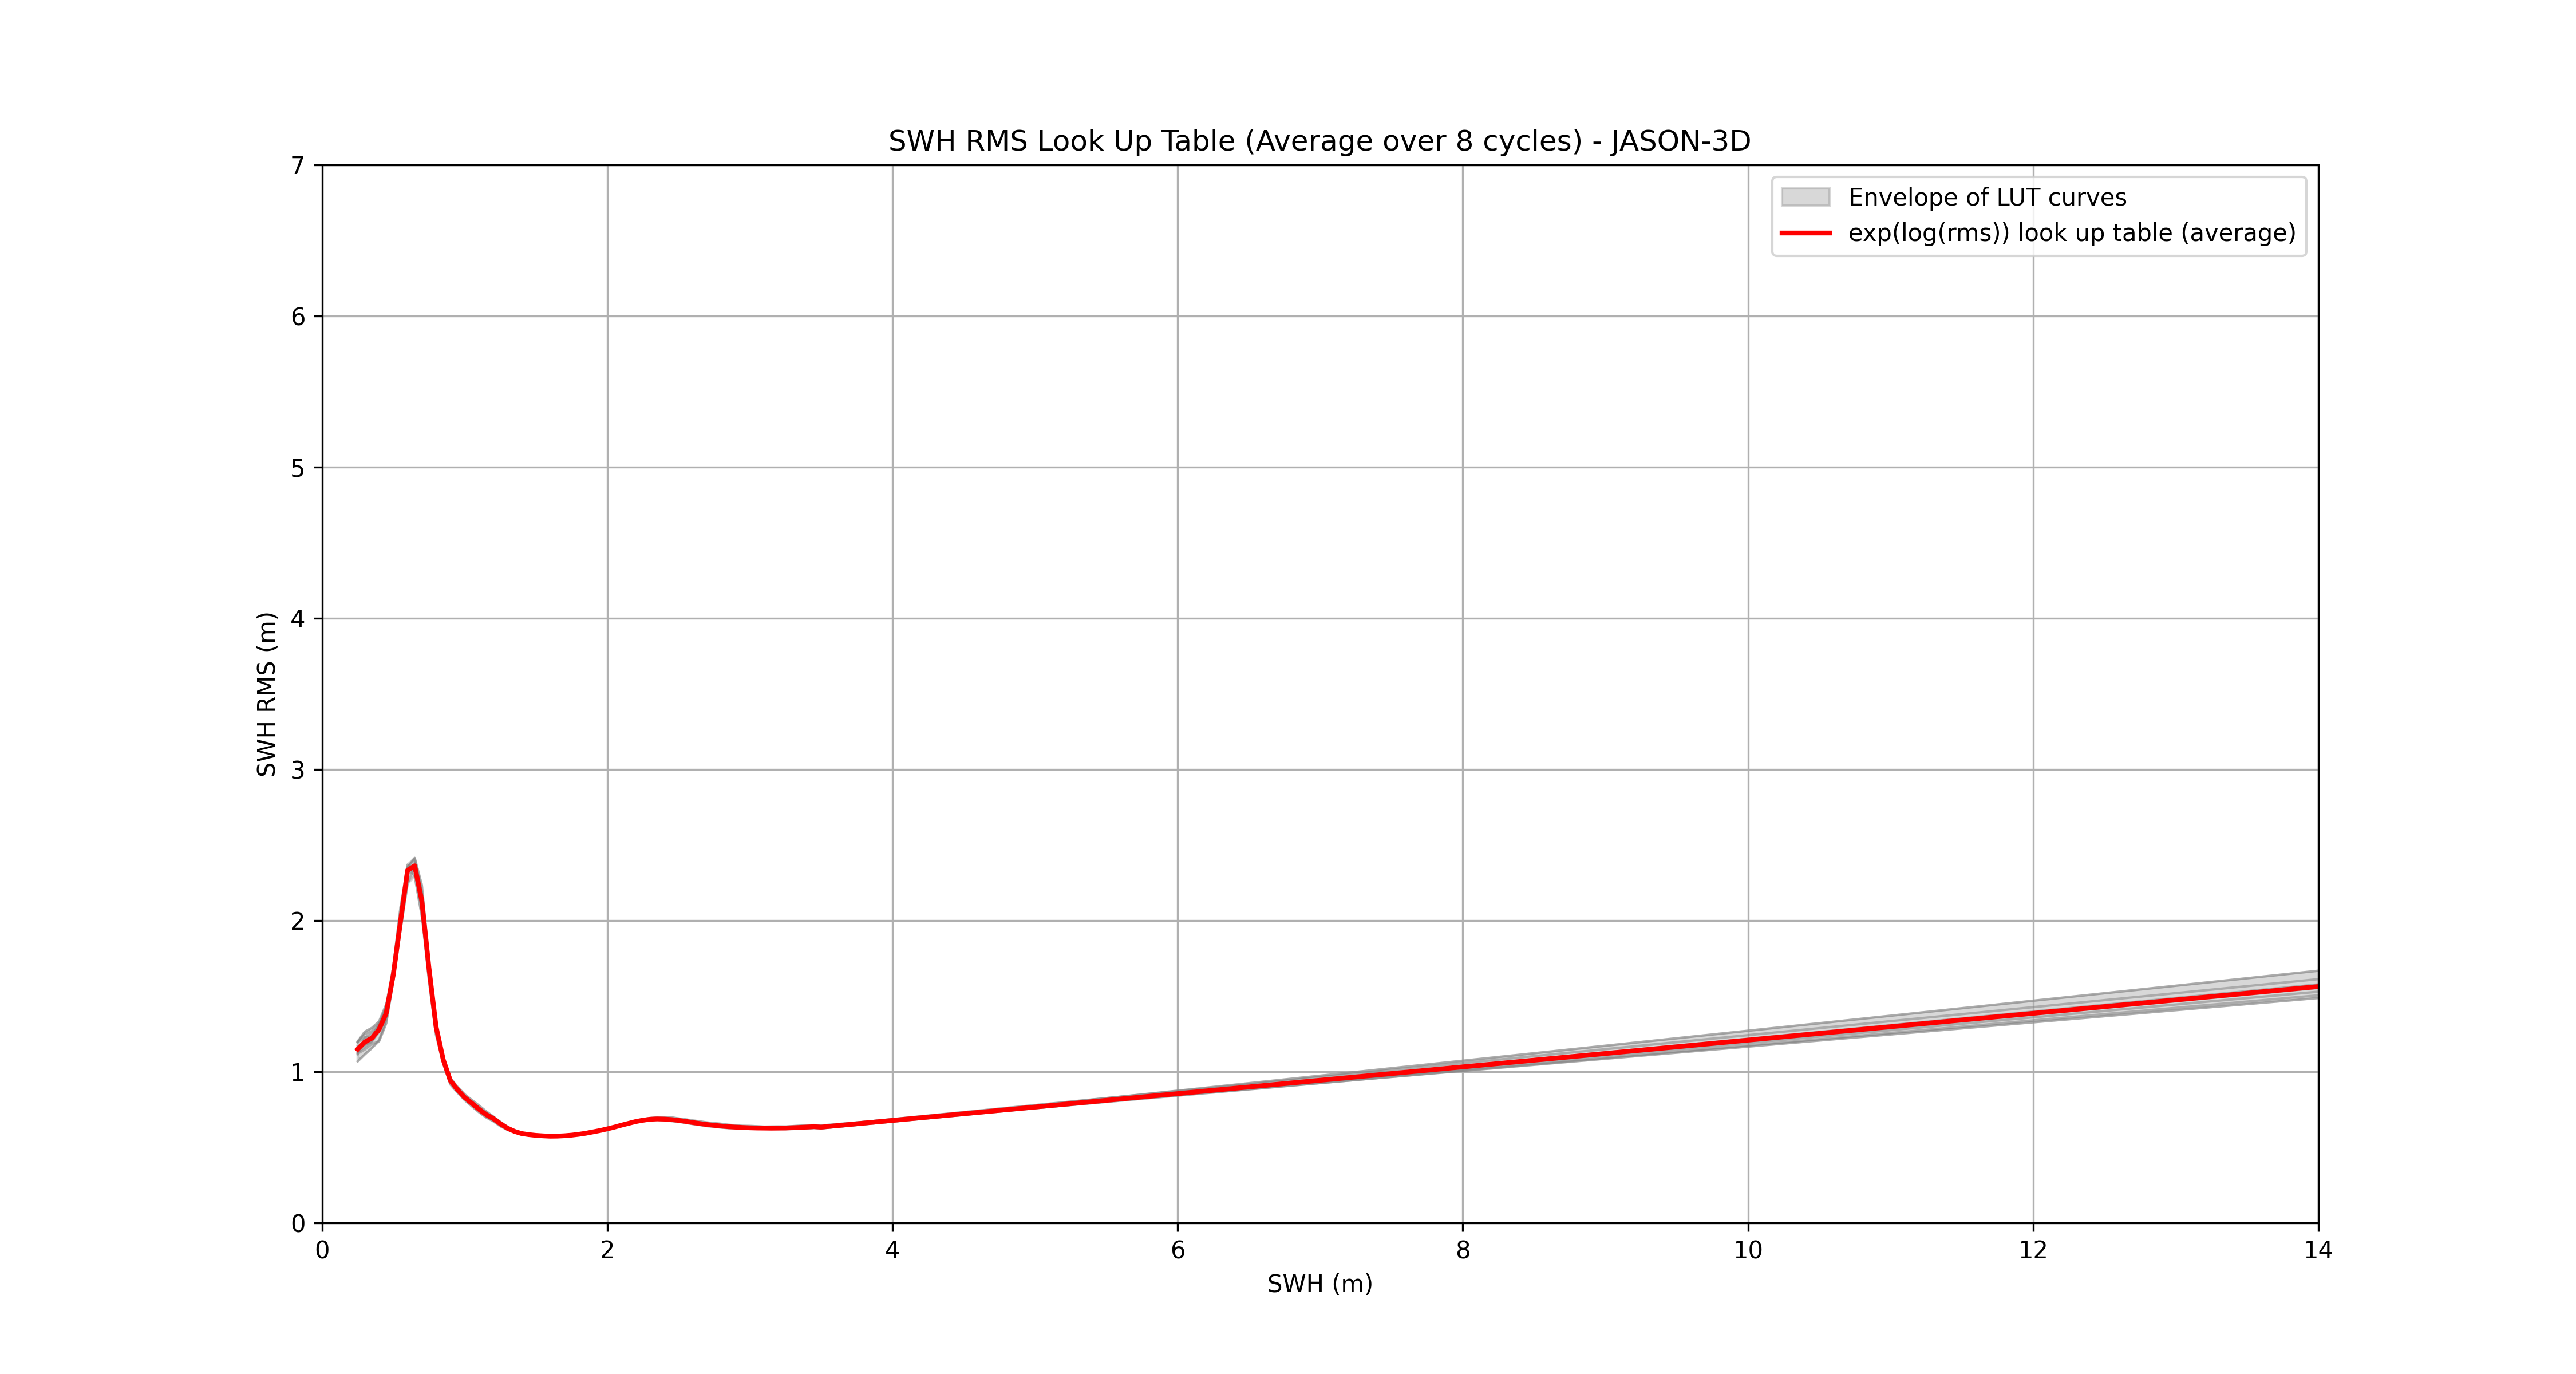
JASON-3D |
74-74-11-46-88-14-26-63 |
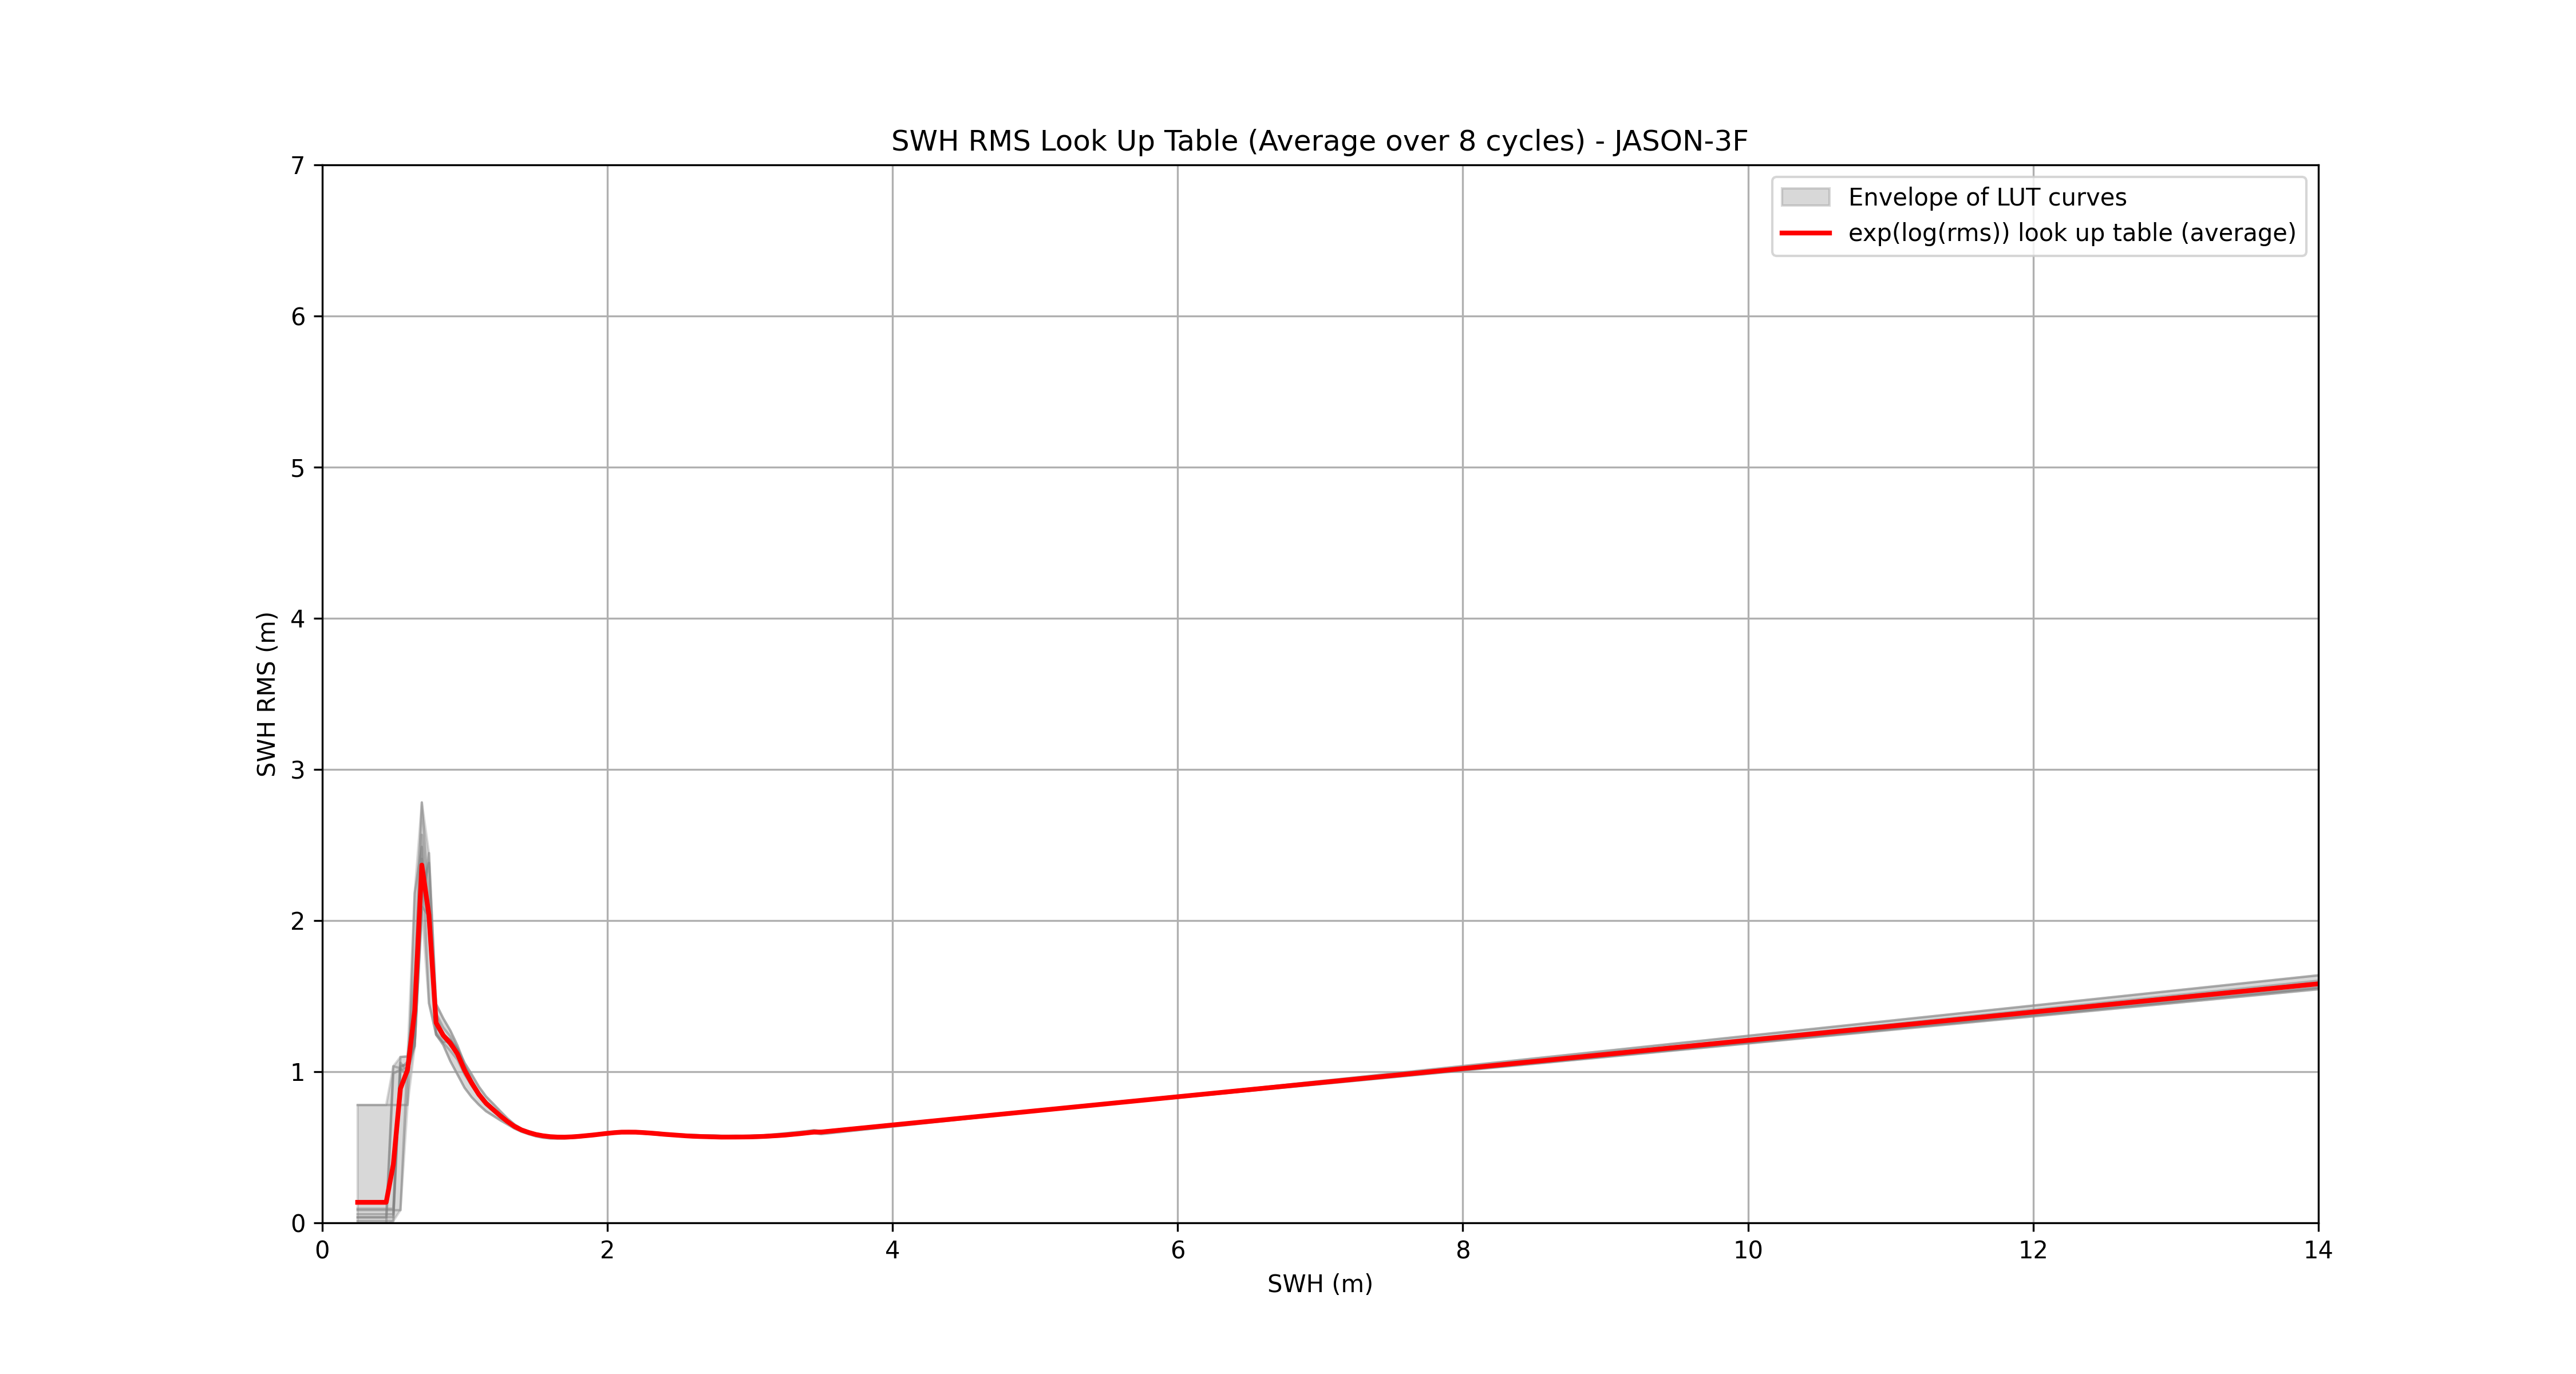
JASON-3F |
319-325-194-196-348-349-356-357 |
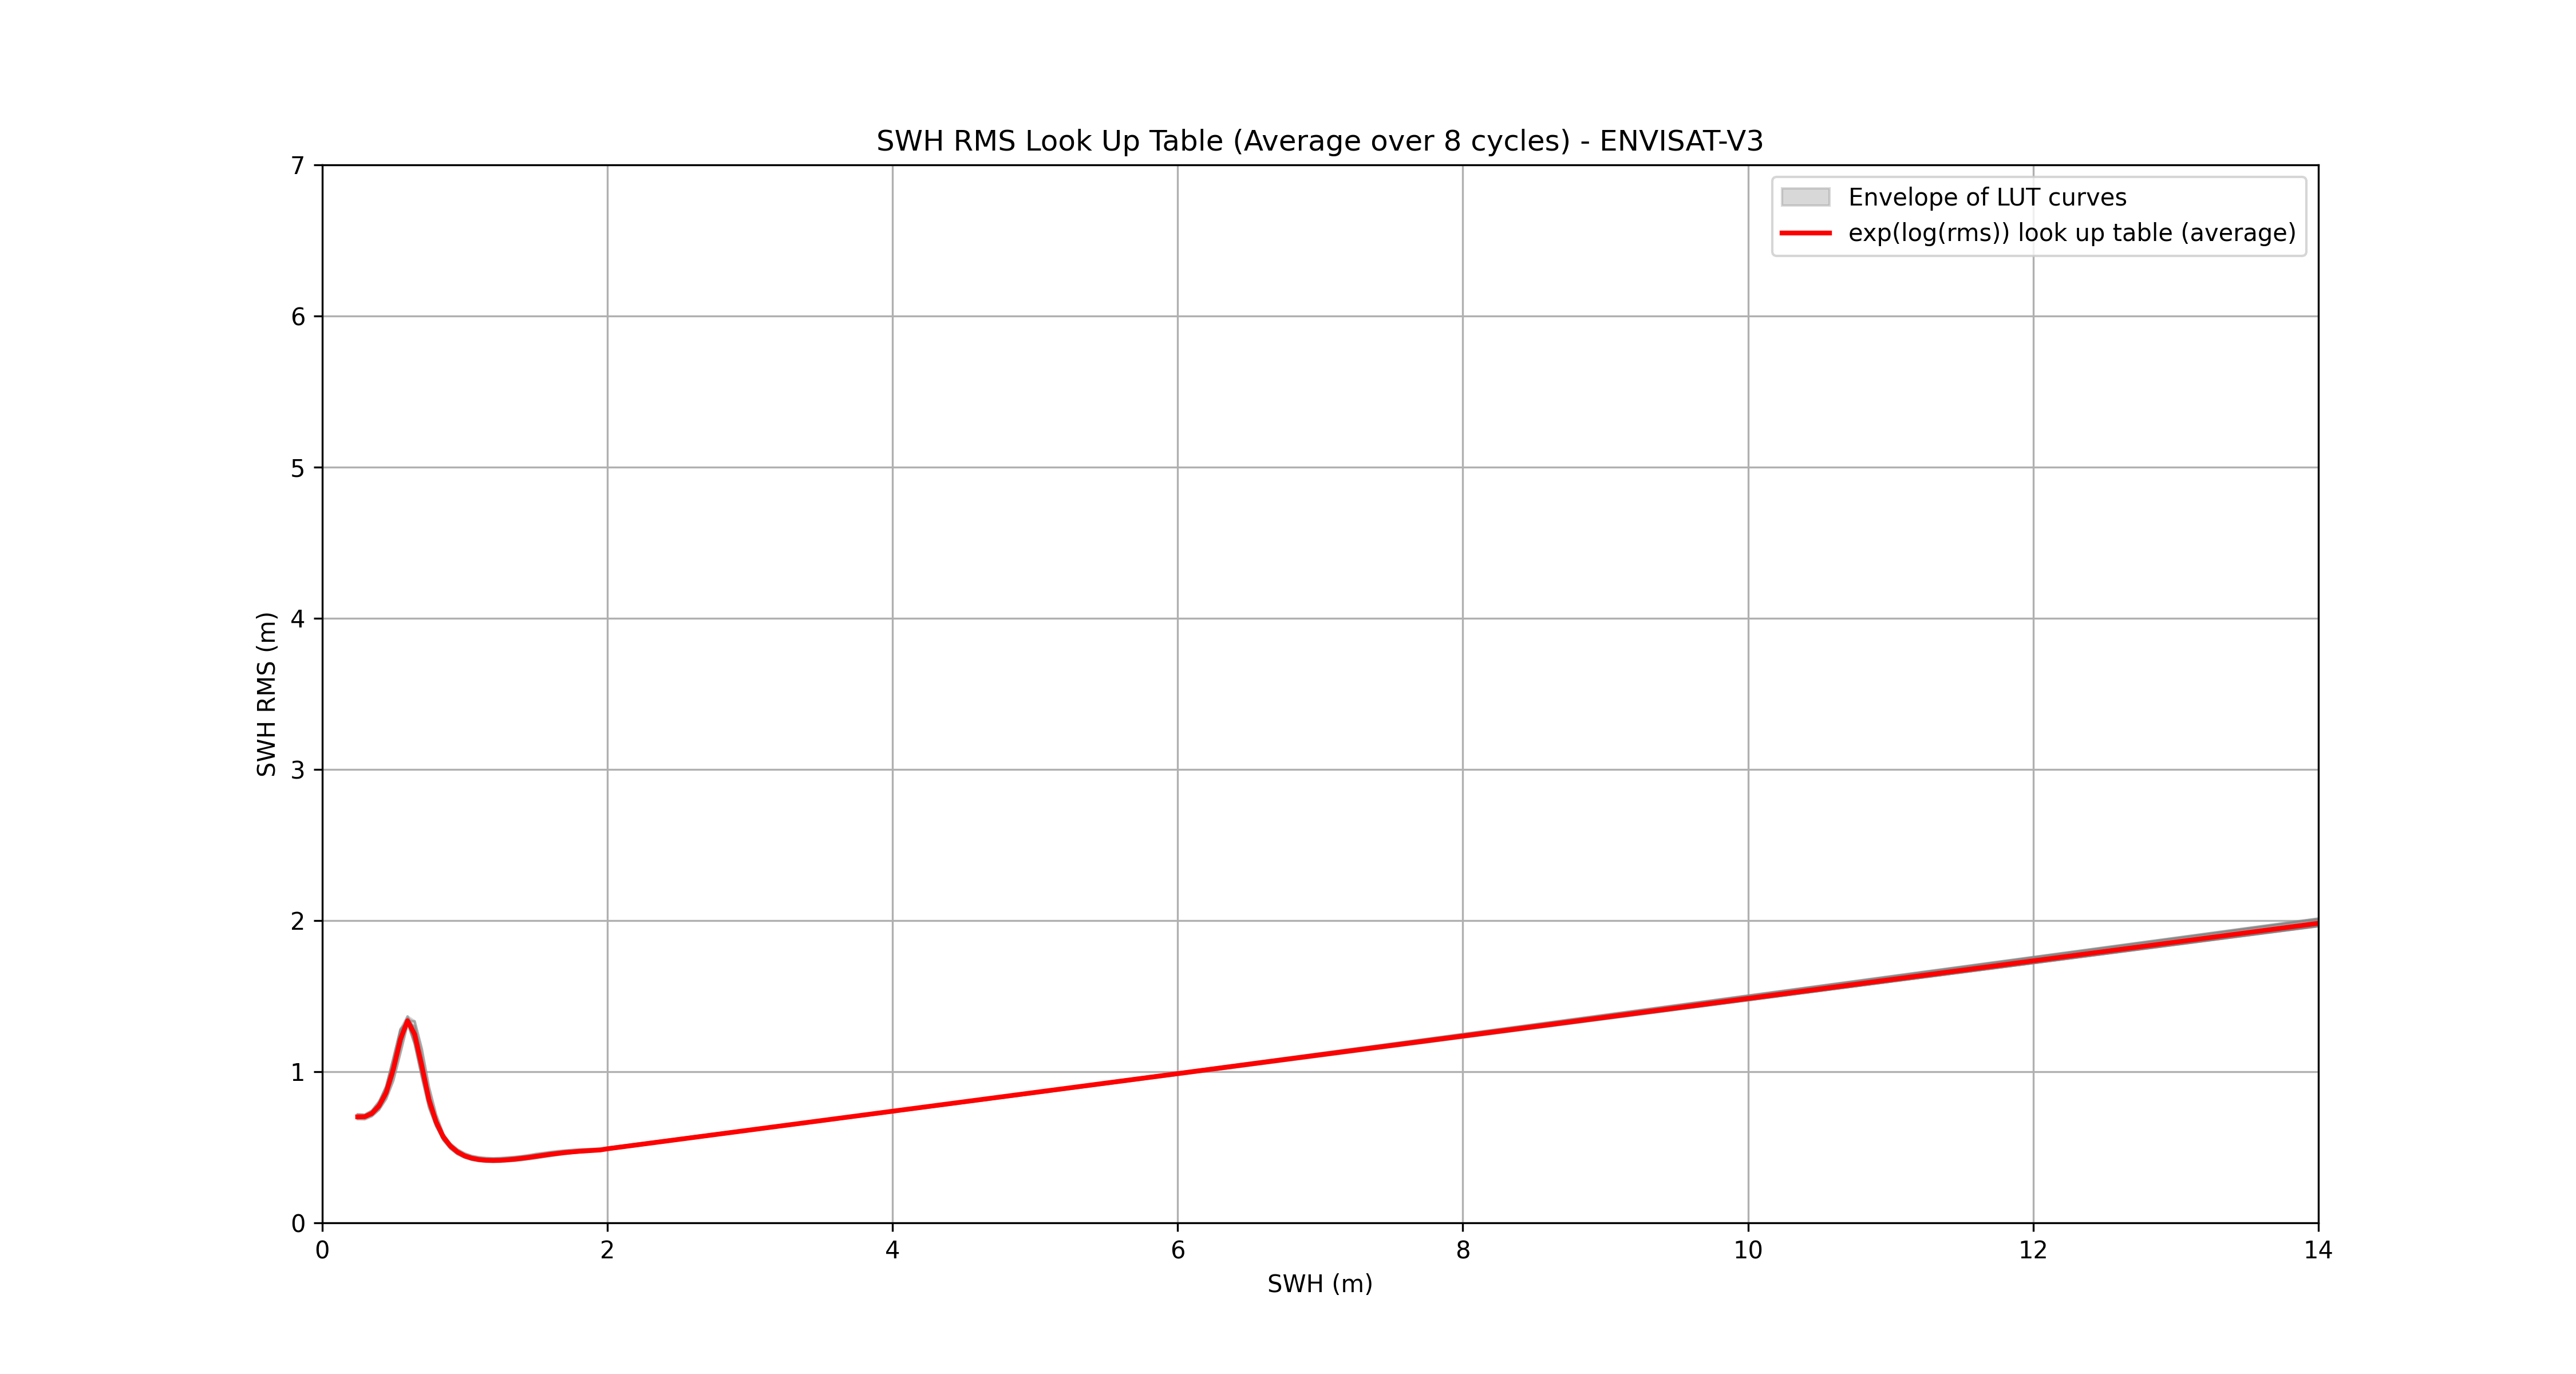
ENVISAT-V3 |
105-54-77-84-87-89-96-9 |
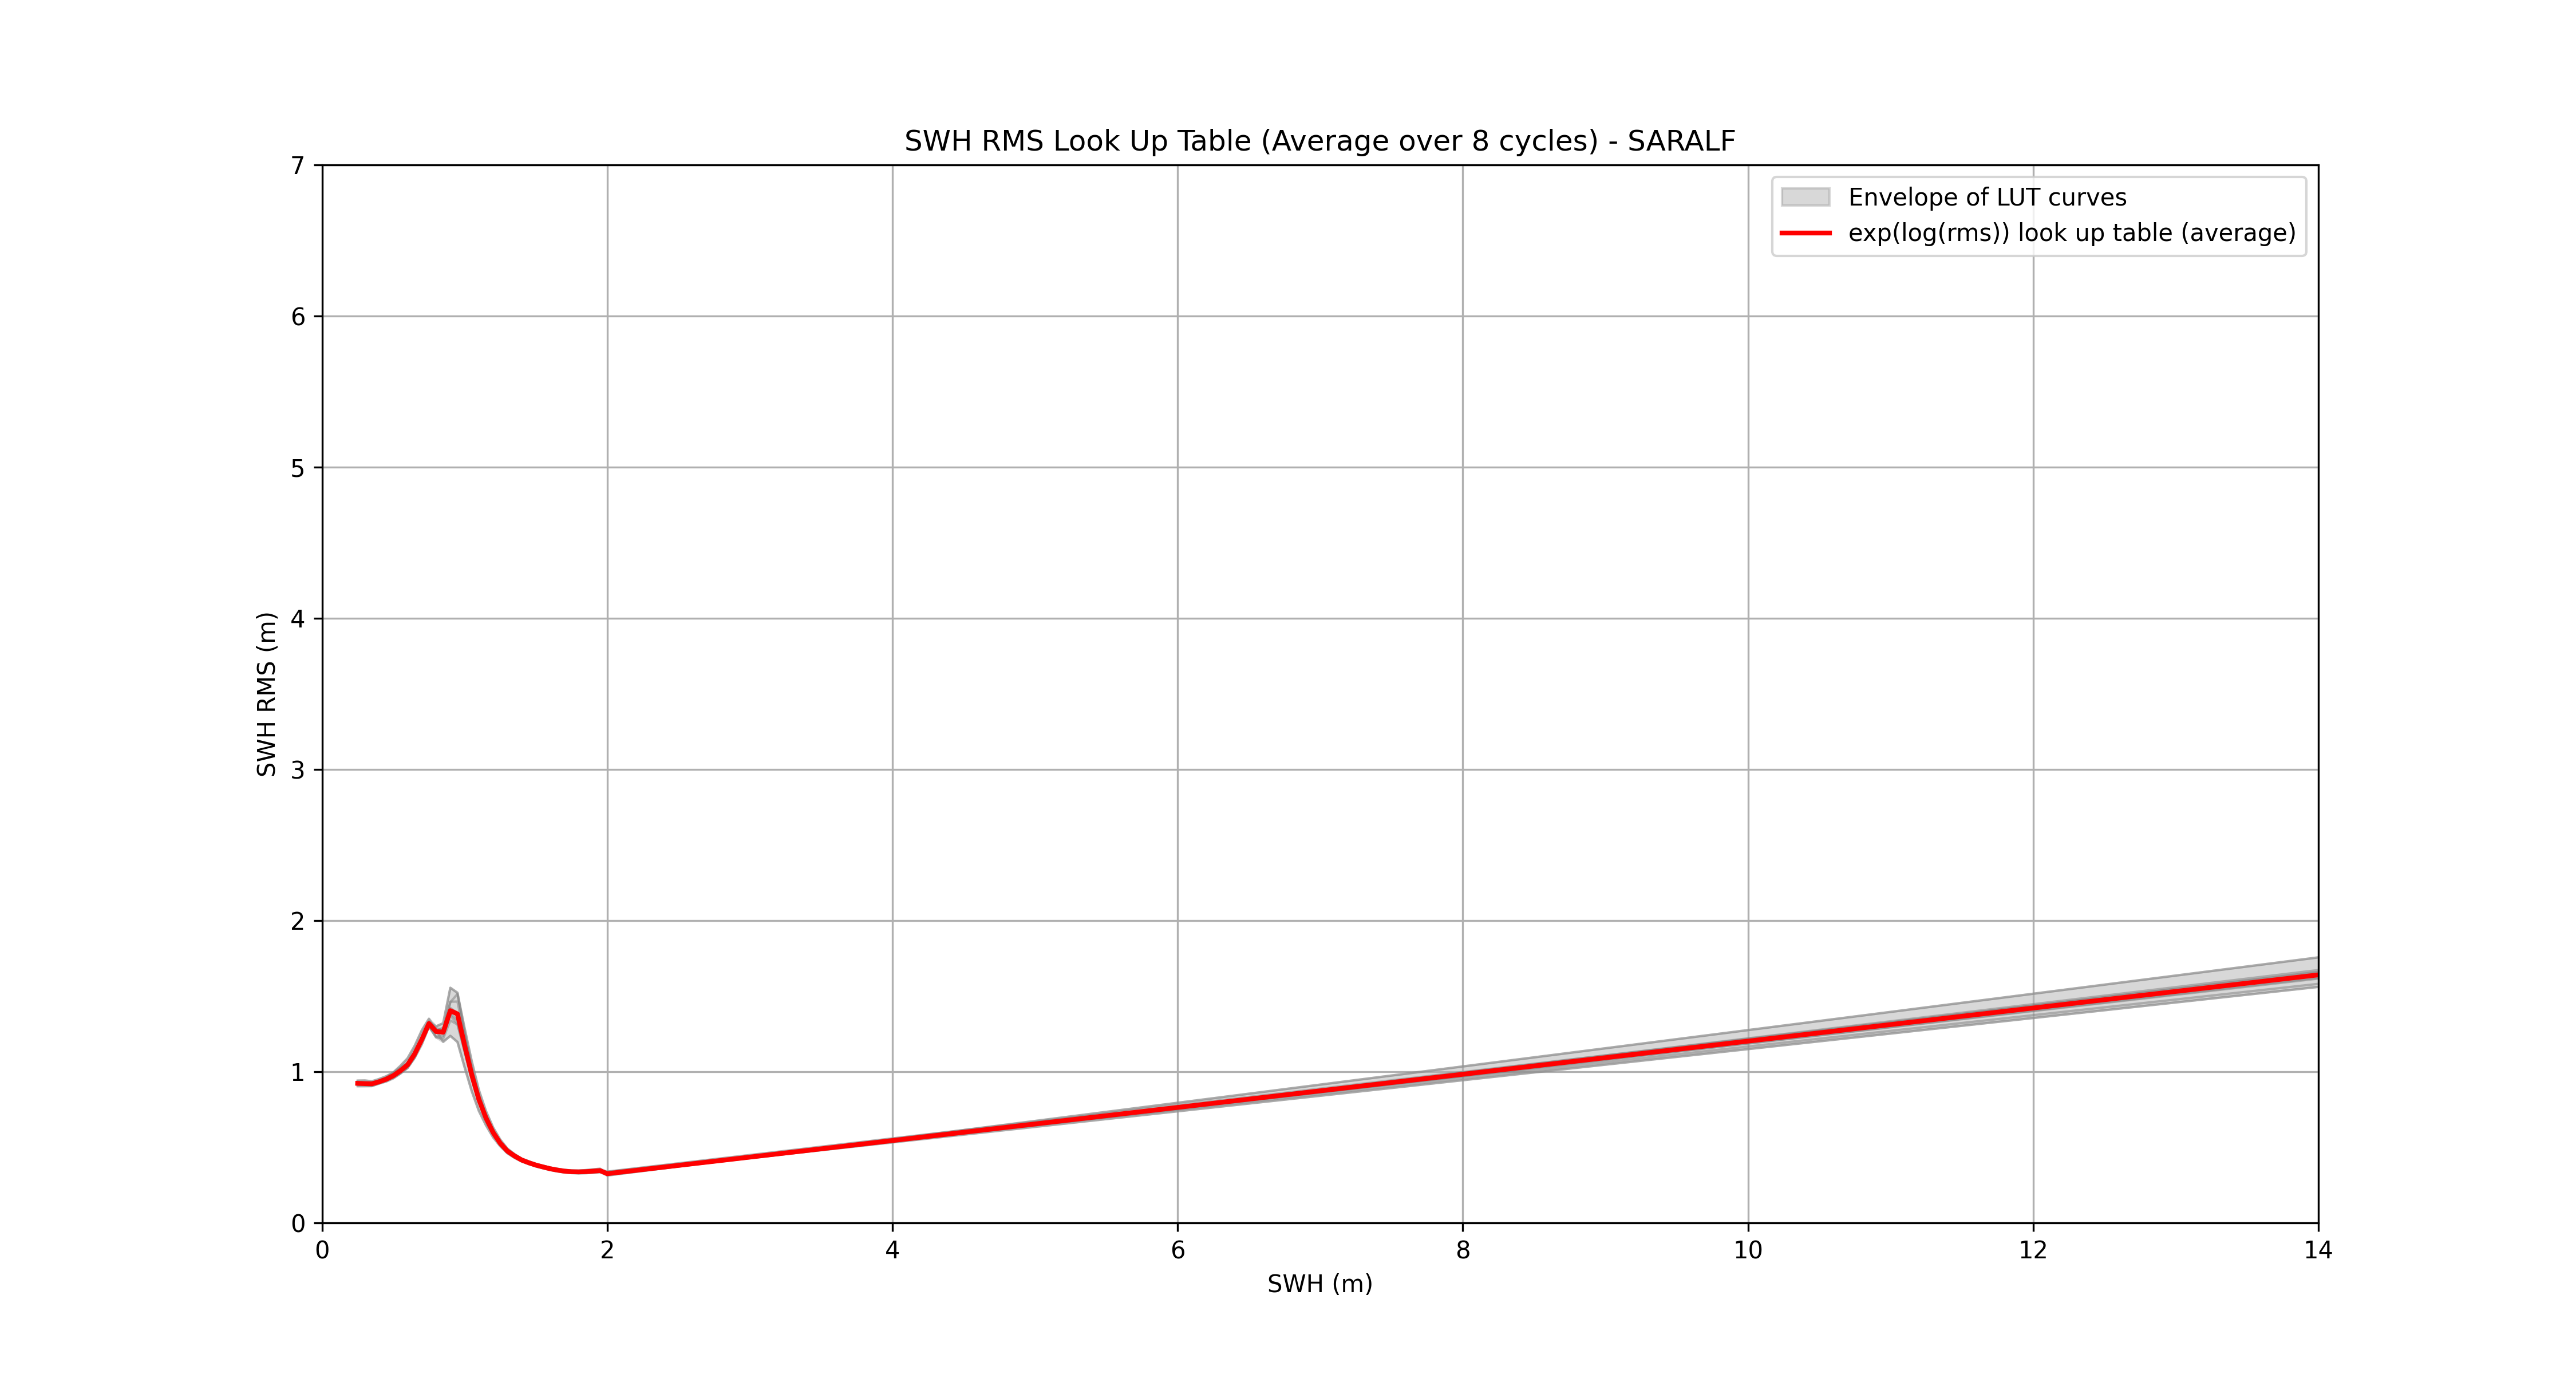
SARAL |
105-21-13-22-100-112-6-103 |
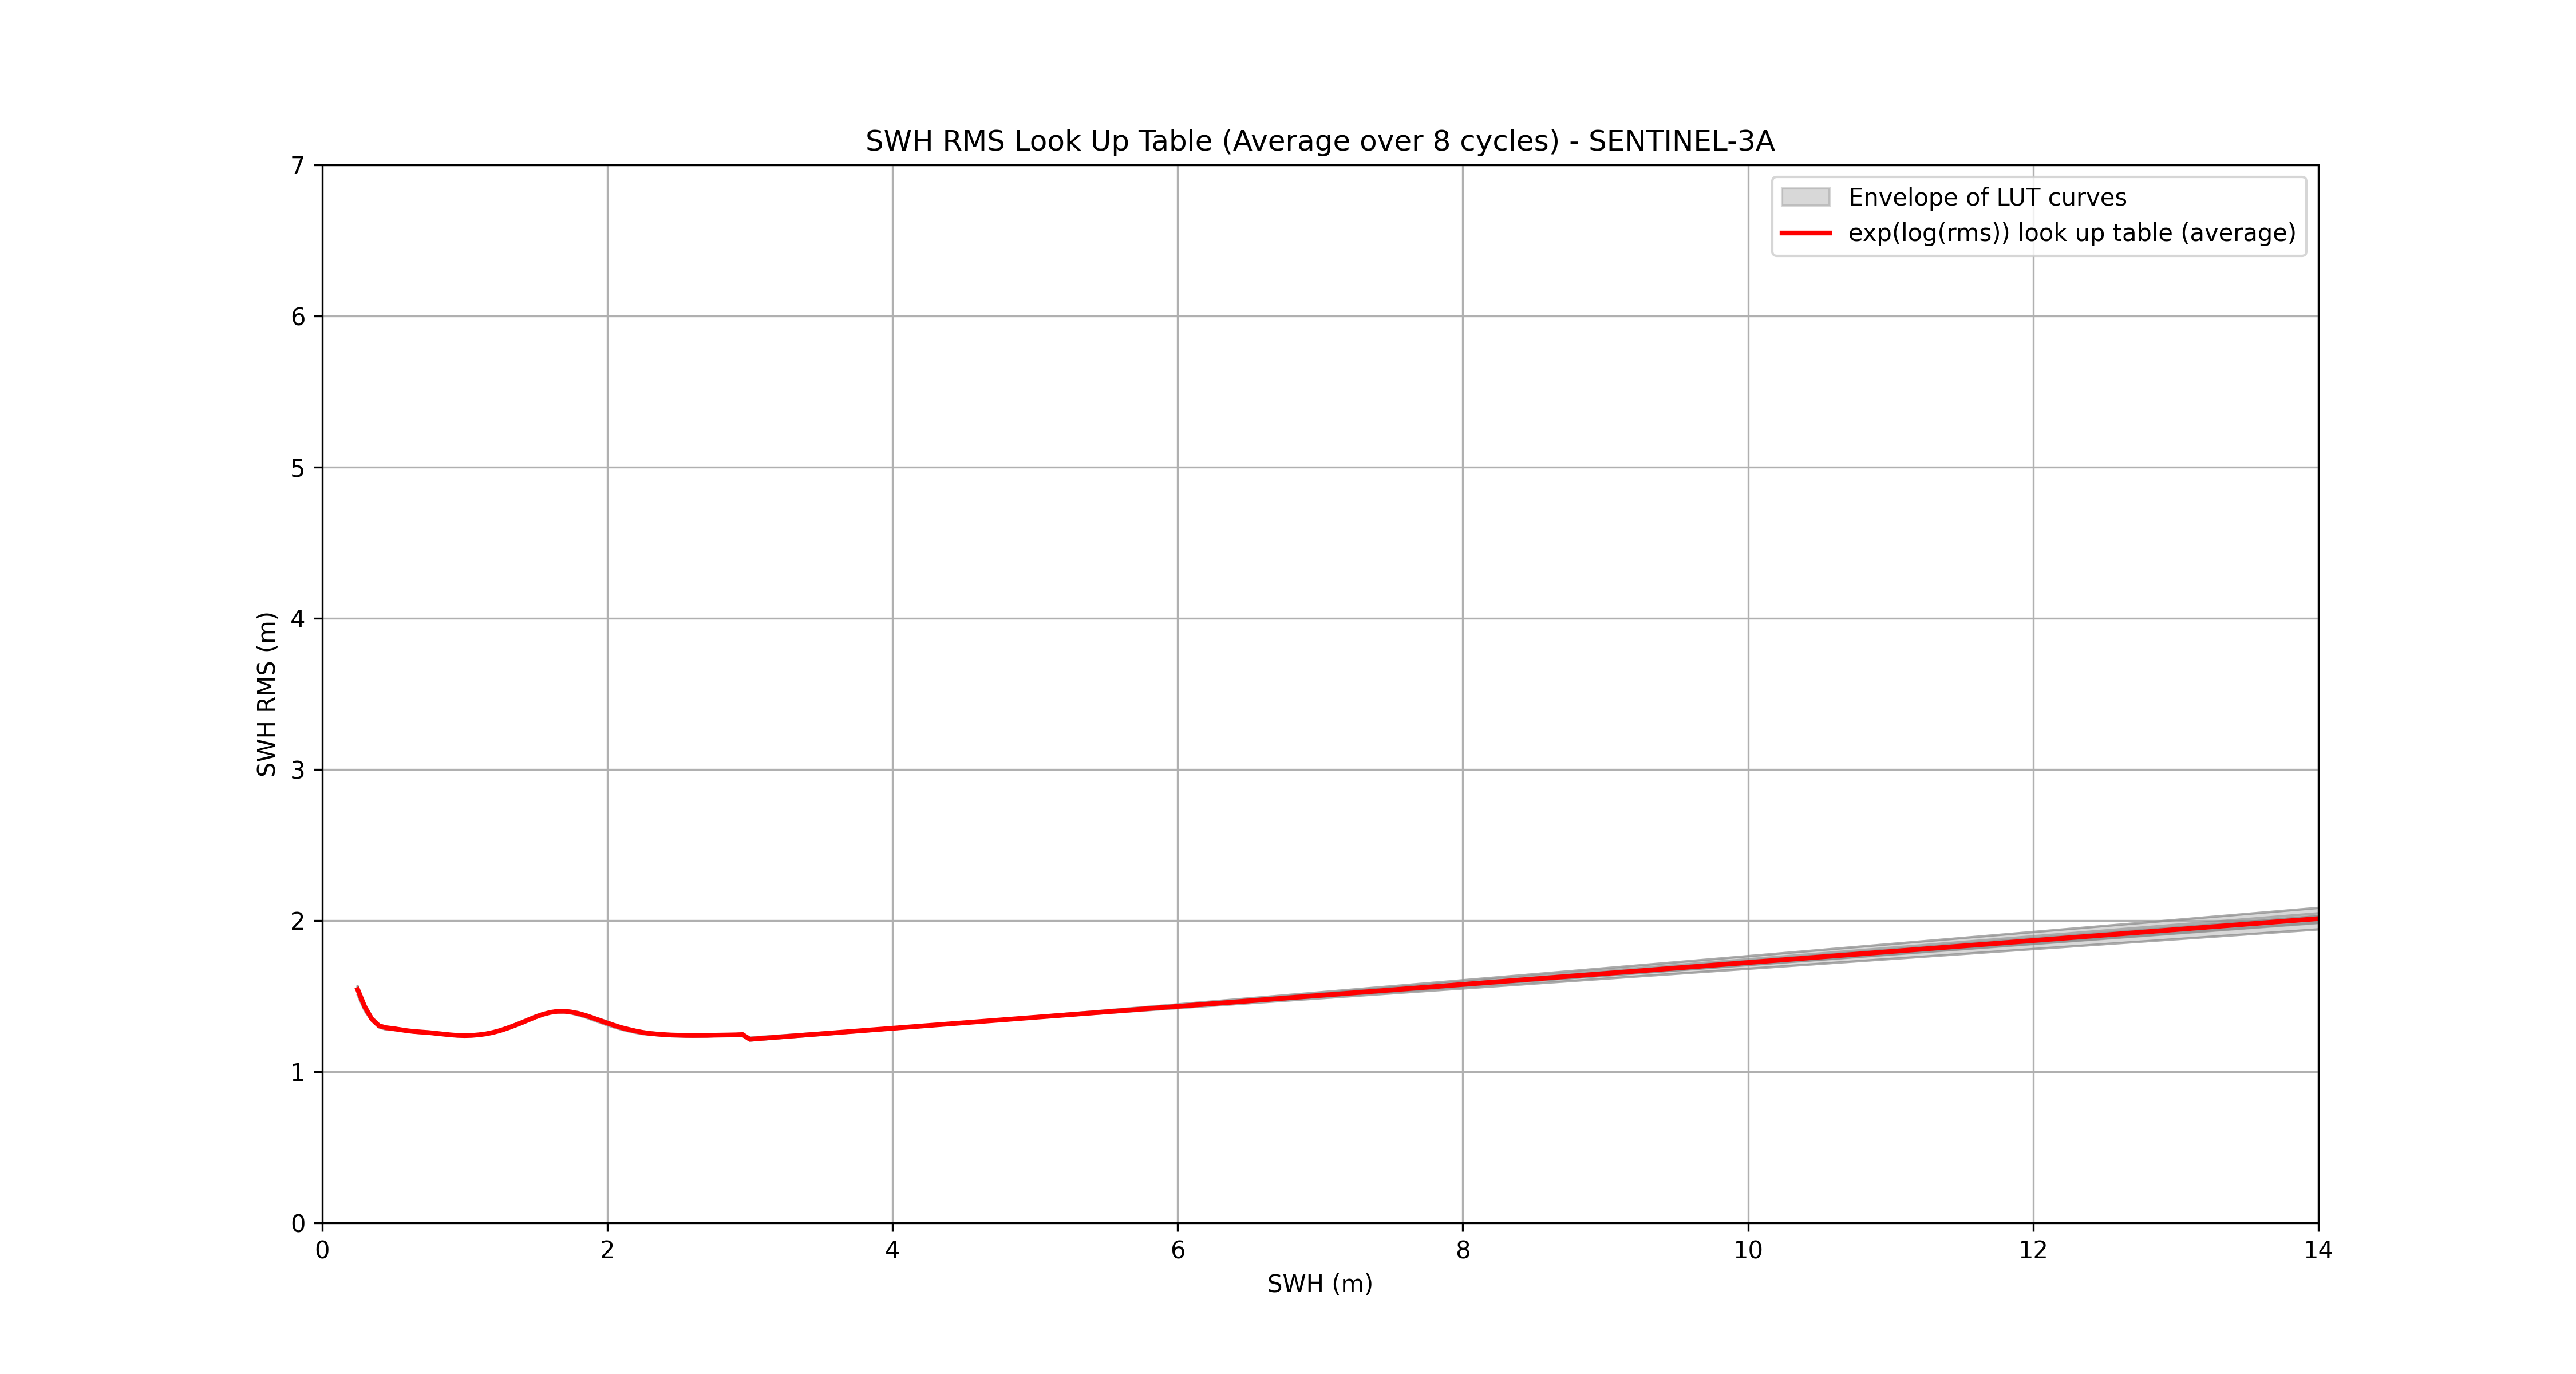
SENTINEL-3A |
10-27-34-37-49-59-62-65 |
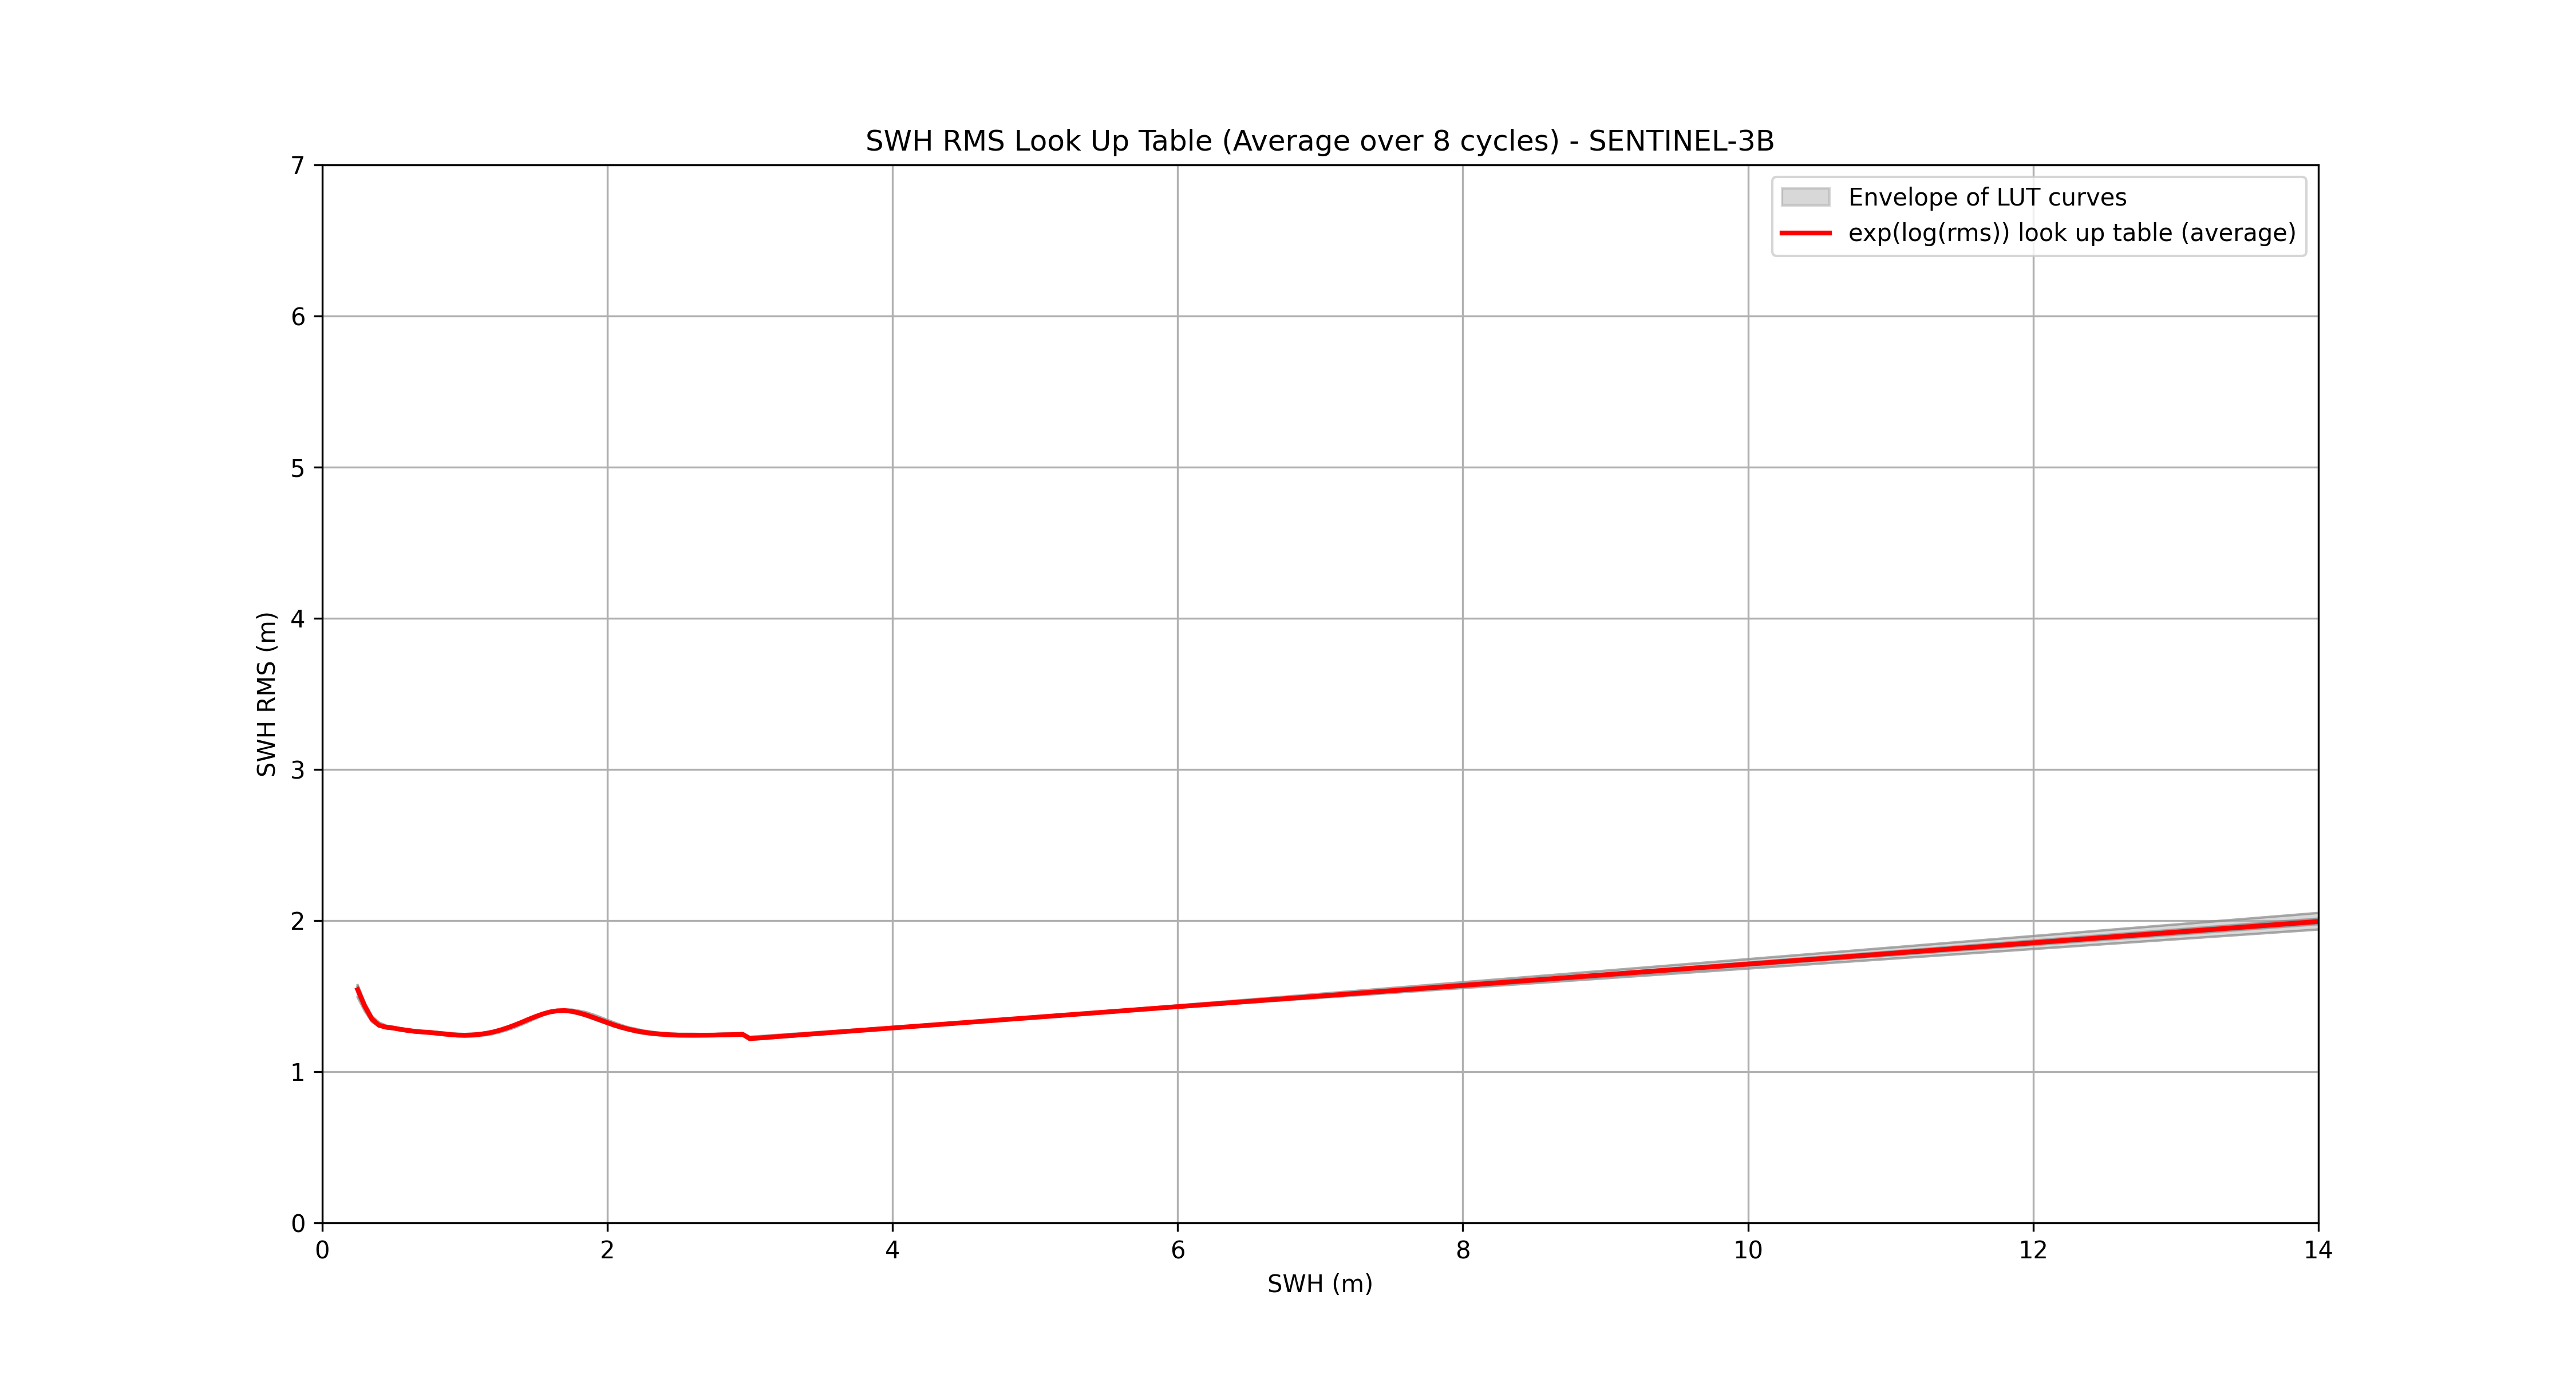
SENTINEL-3B |
11-21-25-27-31-47-48-51 |
SENTINEL-6A |
11-12-17-21-25-27-31-47 |
Methodology#
Resulting LUTs#
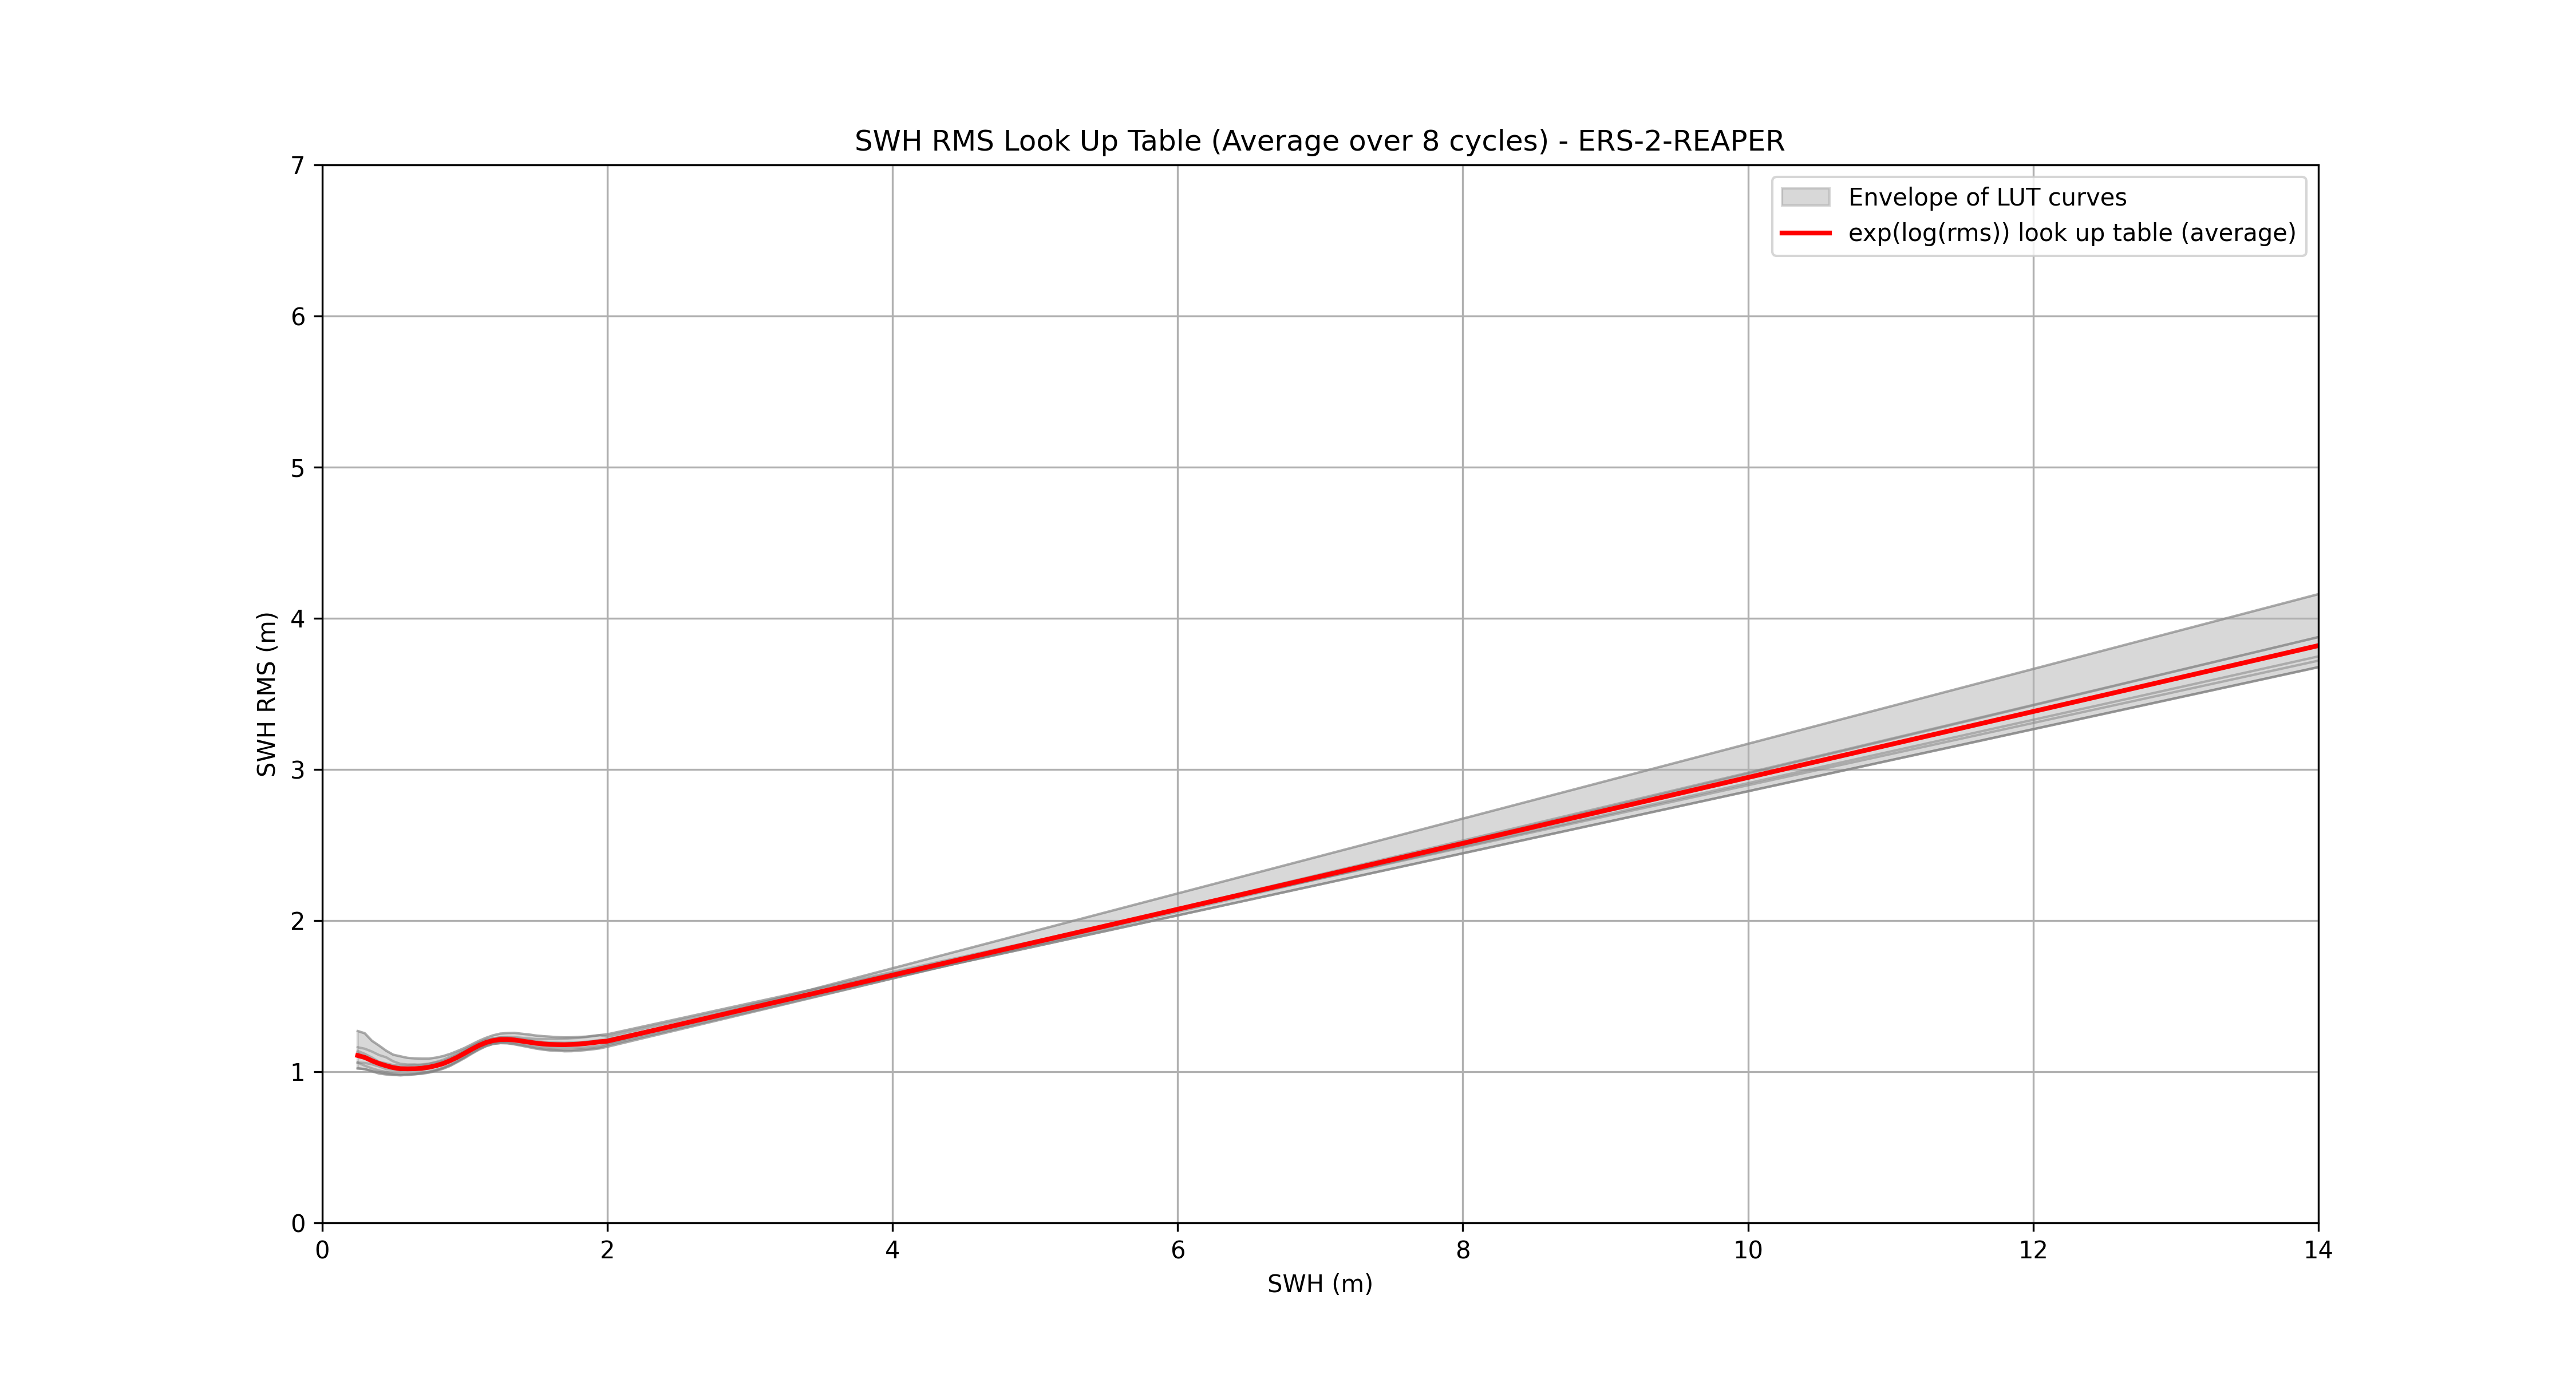
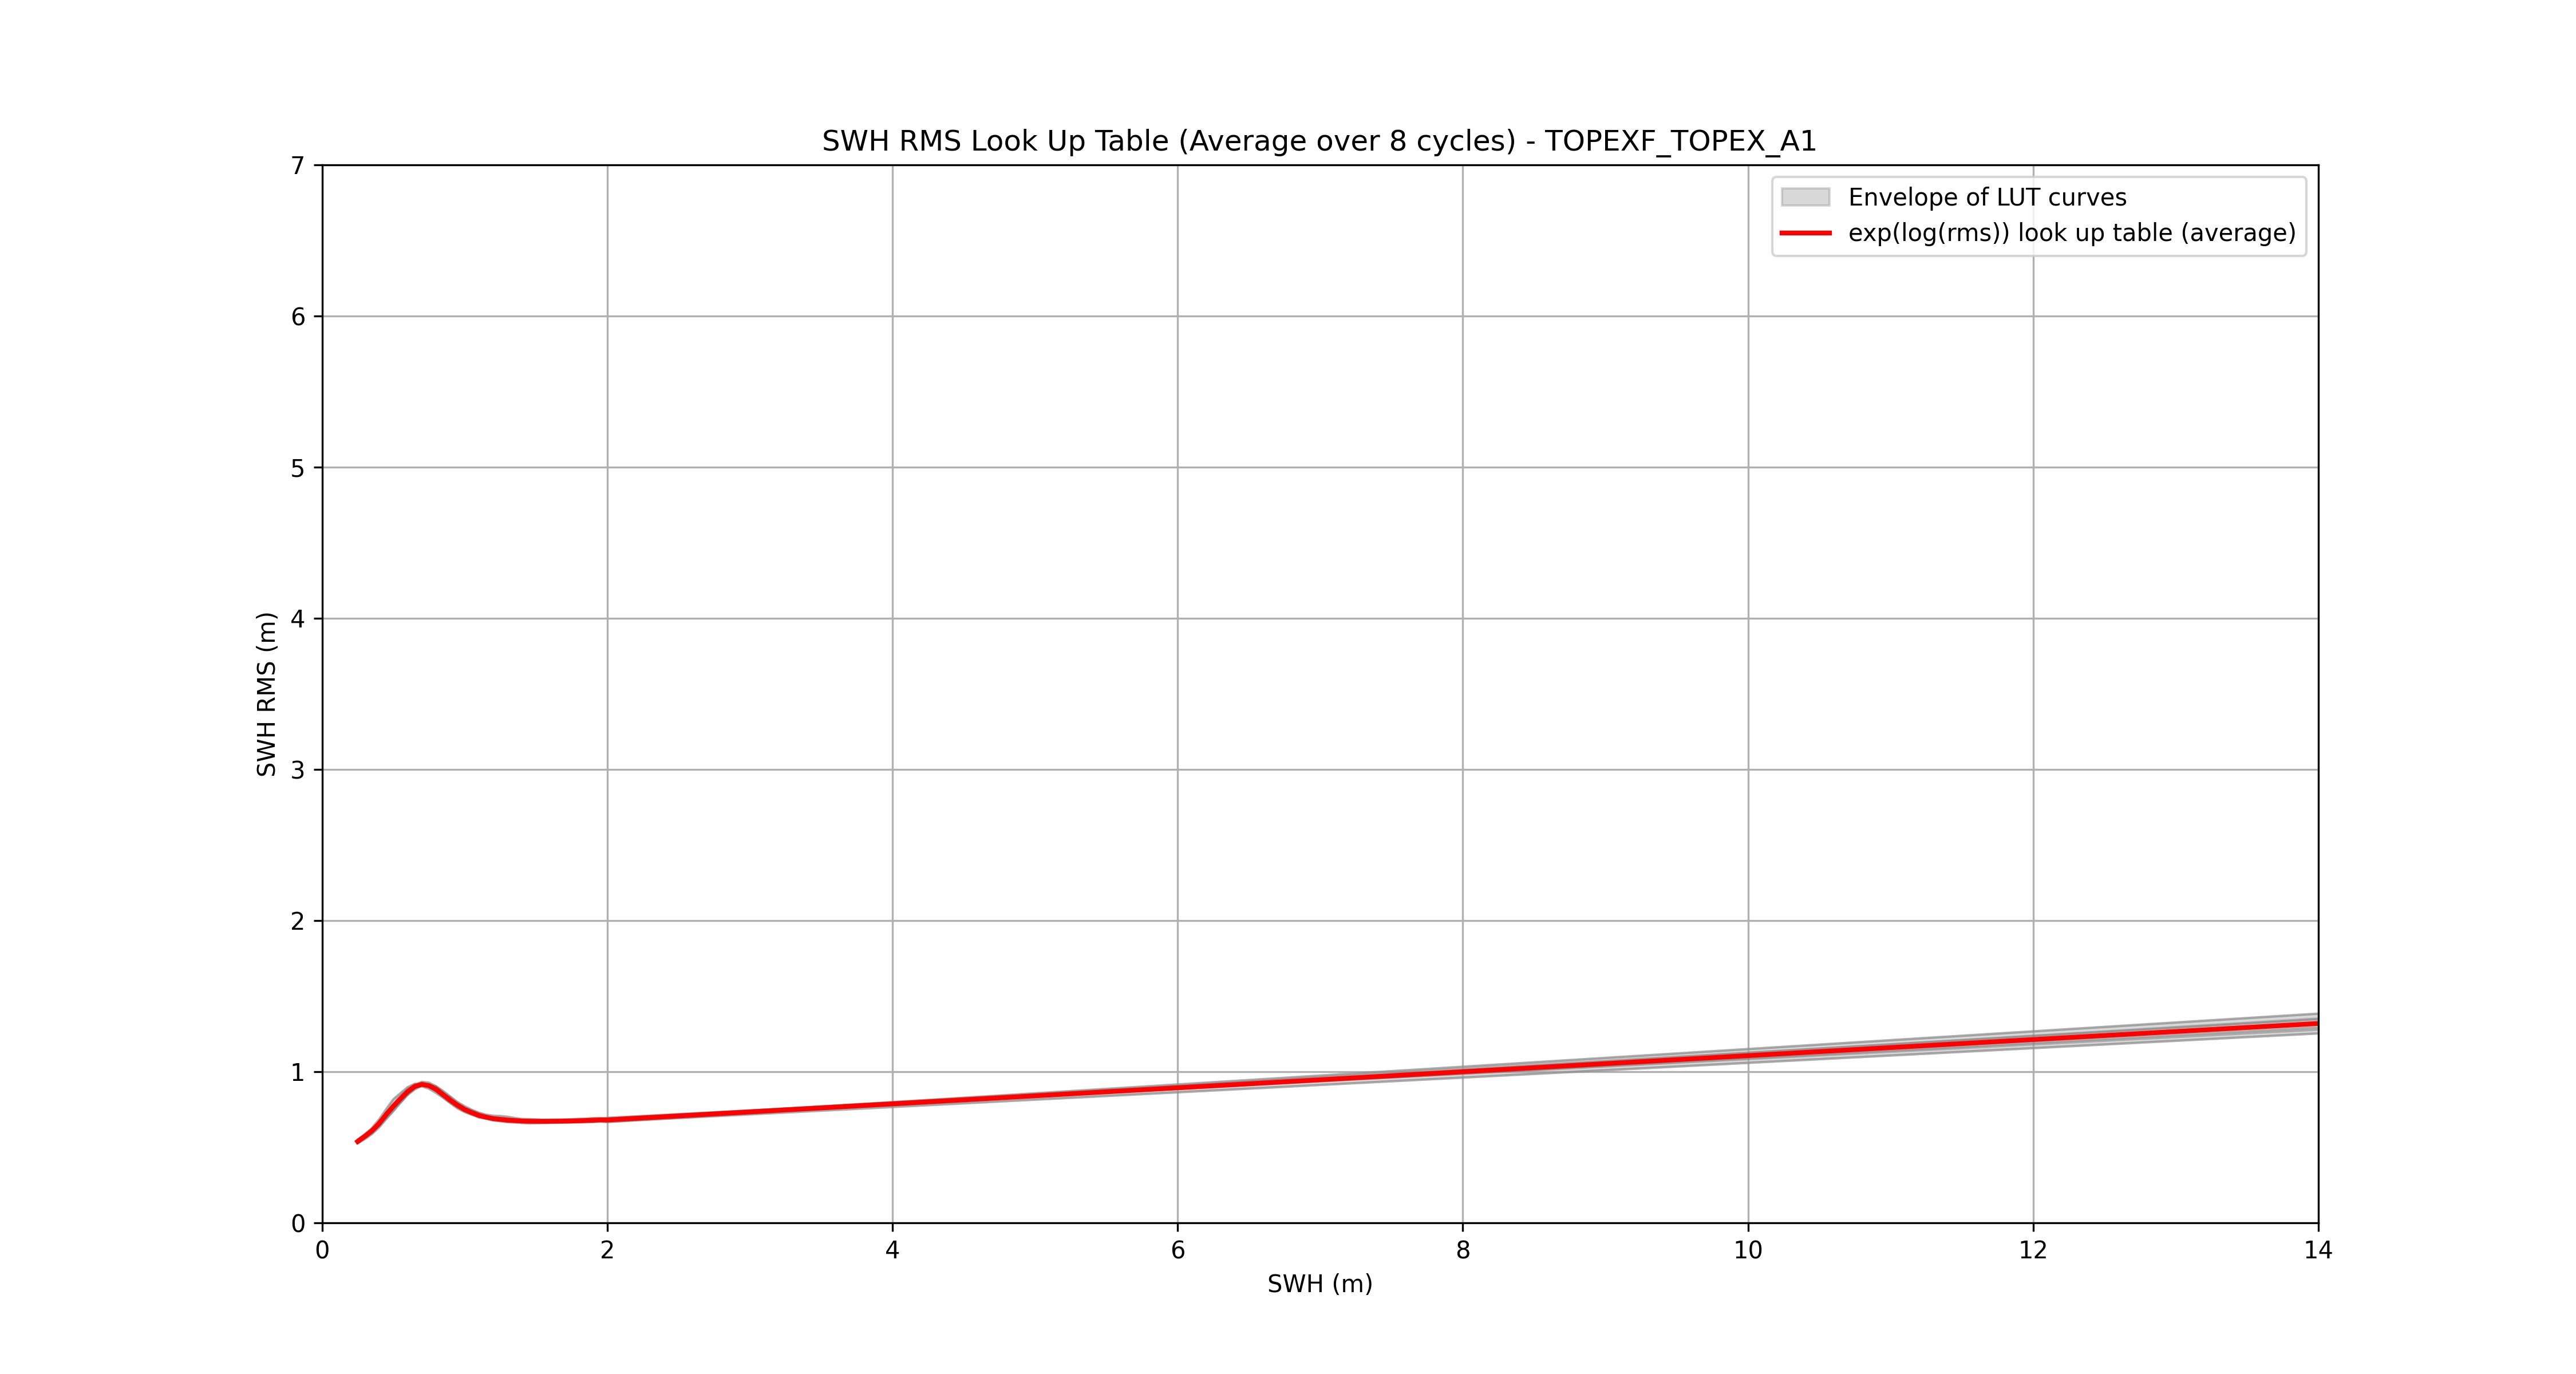
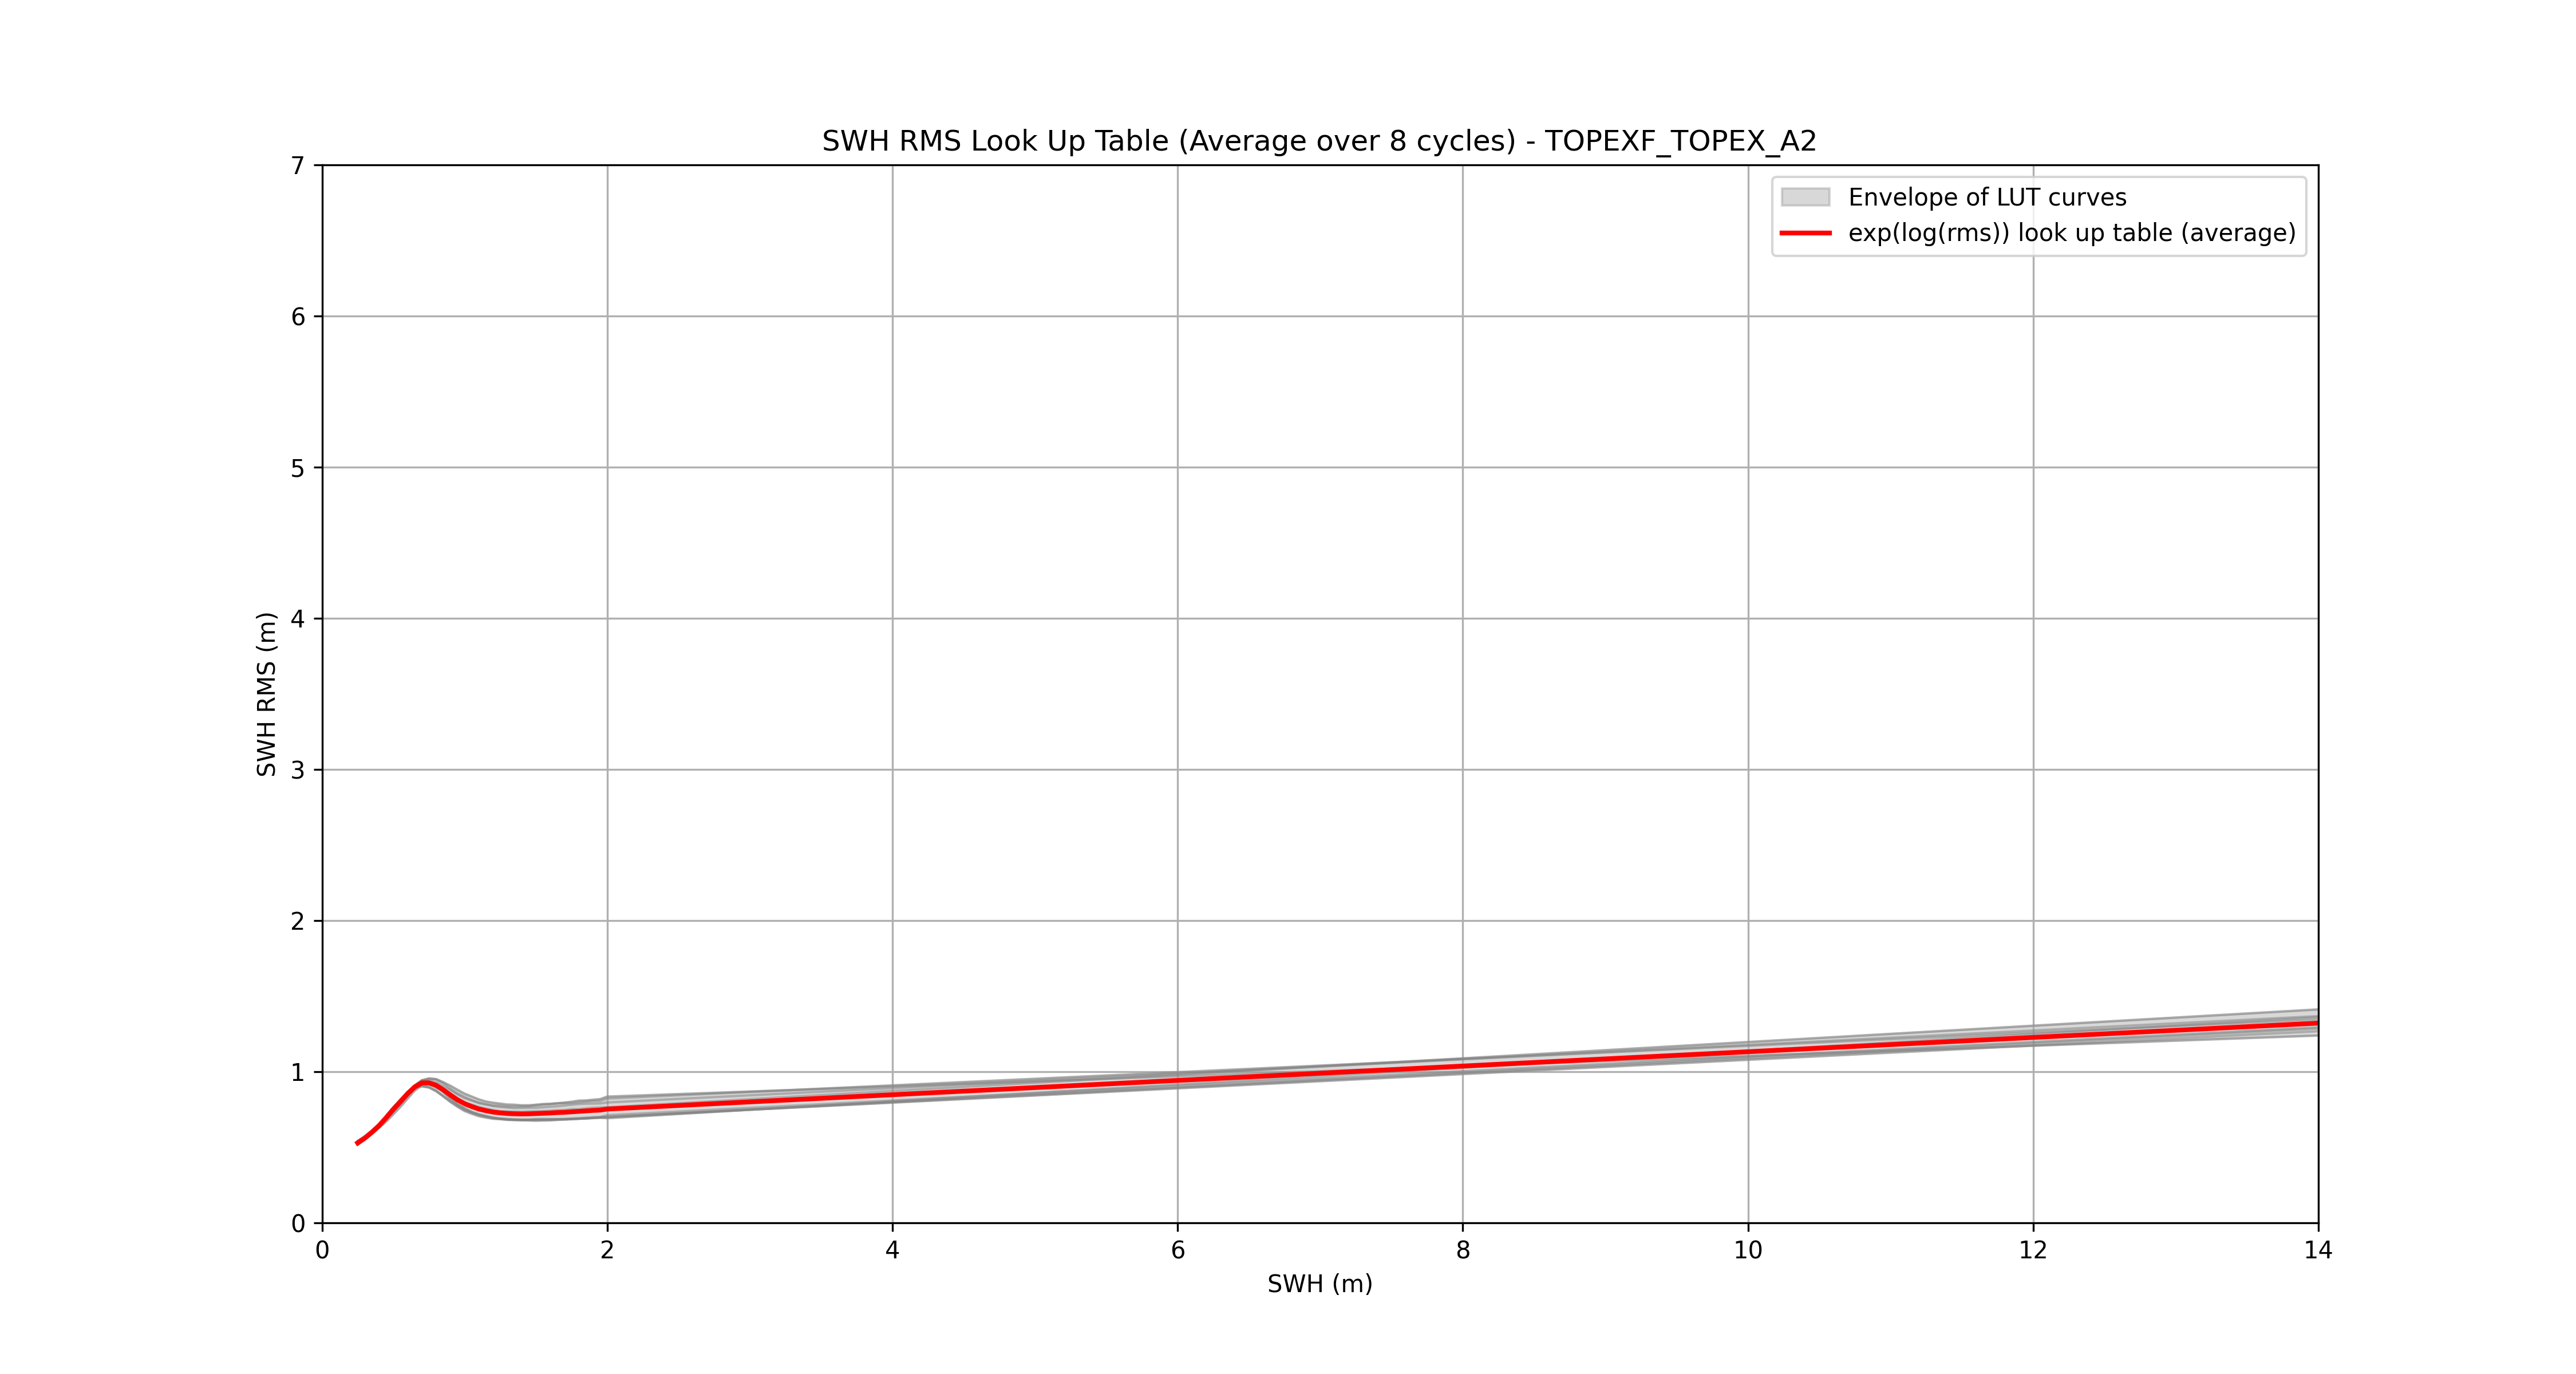
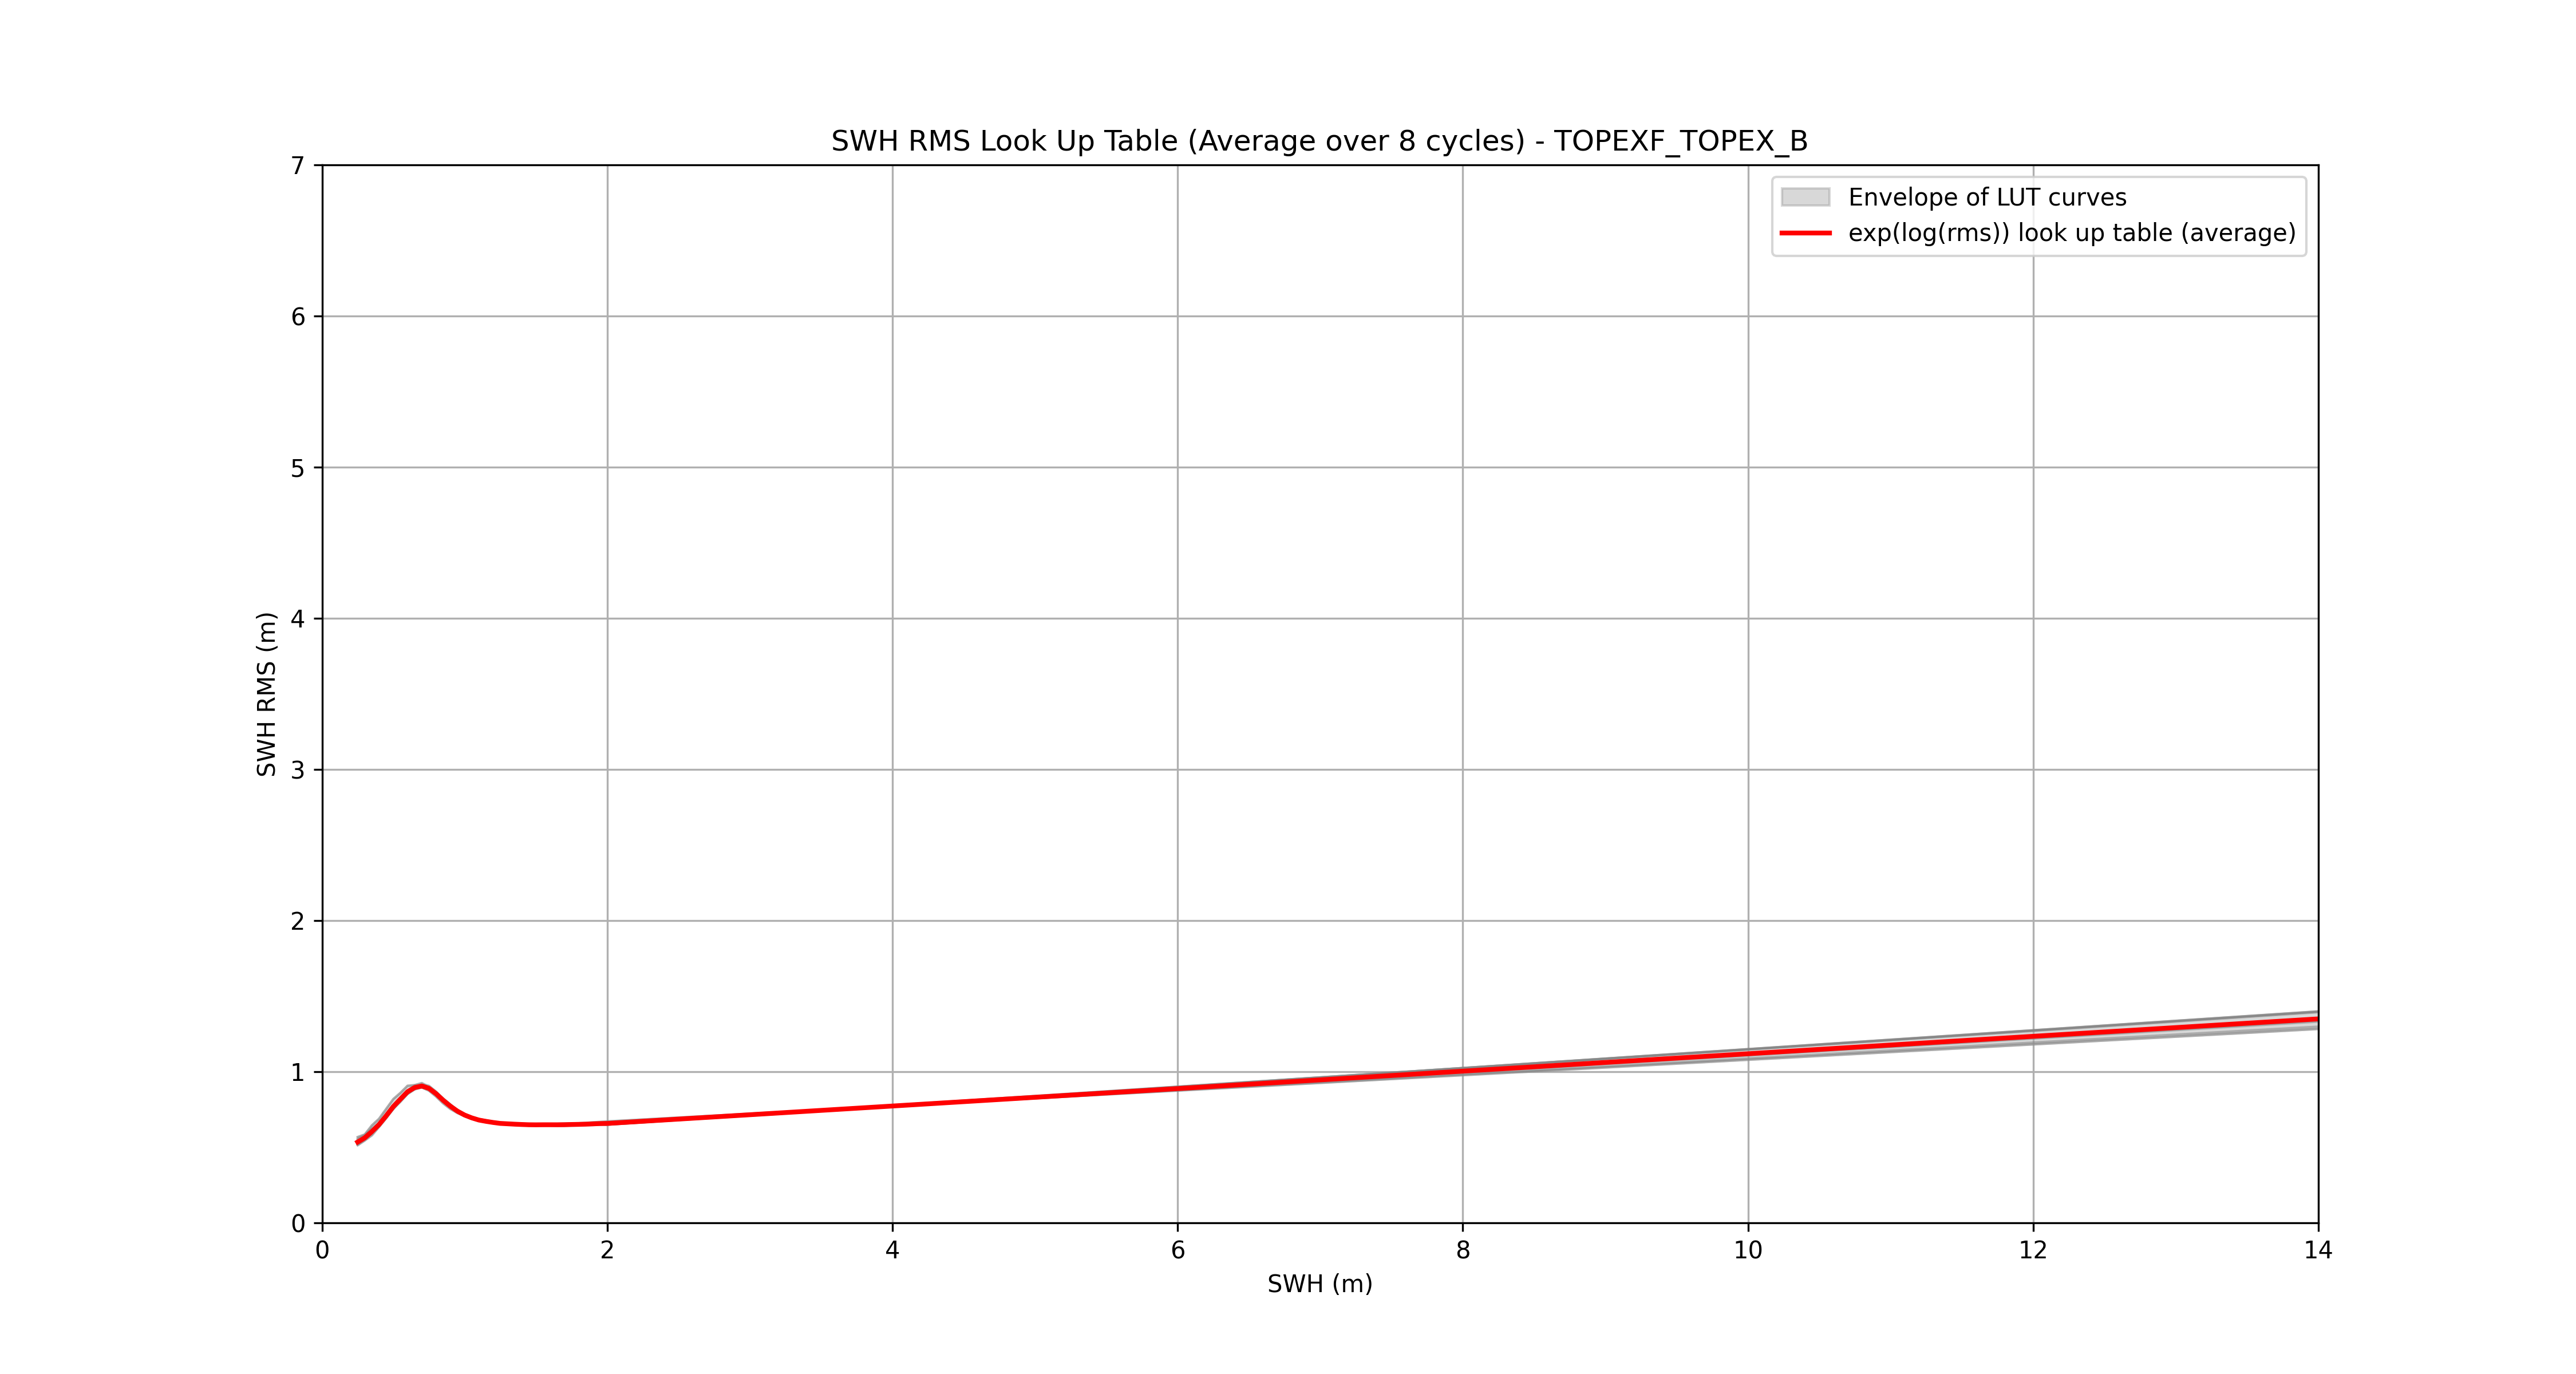
Below, the average LUT estimated for each mission :